Can i plot multipolygon by simply pasting the code in the popup?
I’m trying to plot a line using :{“type”:“Polygon”,“coordinates”:[[[99.78736,3.84262],[99.80011,3.83161]]]}
and a dot using: {“type”:“Polygon”,“coordinates”:[[[99.80011,3.83161]]]}
It works when i plot one or the other, but i have no clue how to plot both of them.
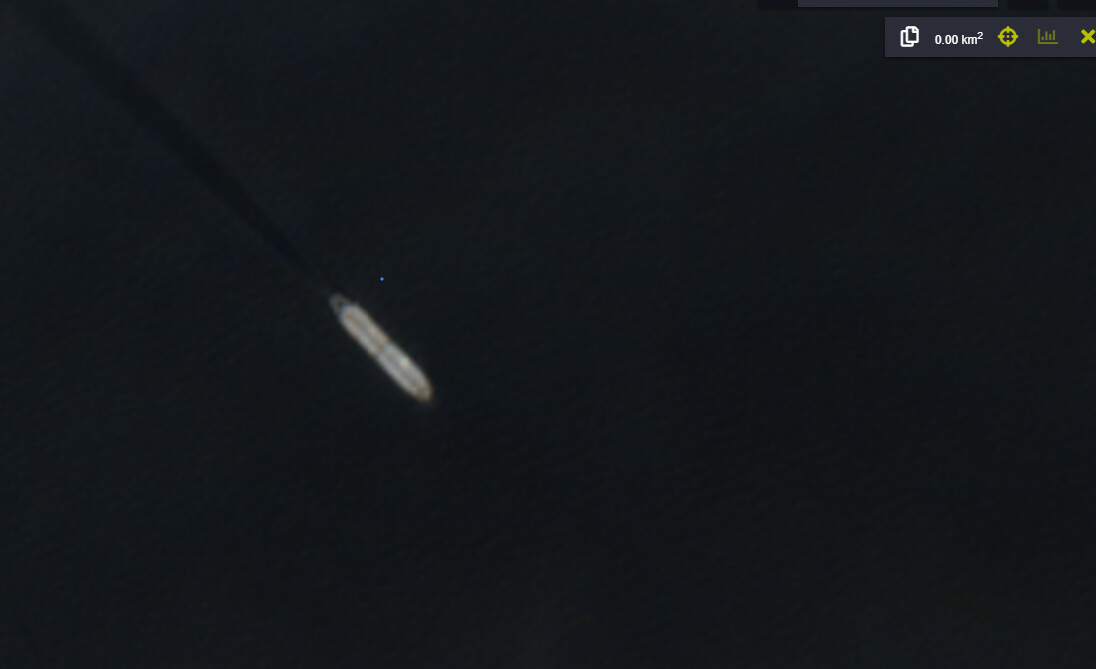
Idea is to pinpoint the position of a ship in the below photo:
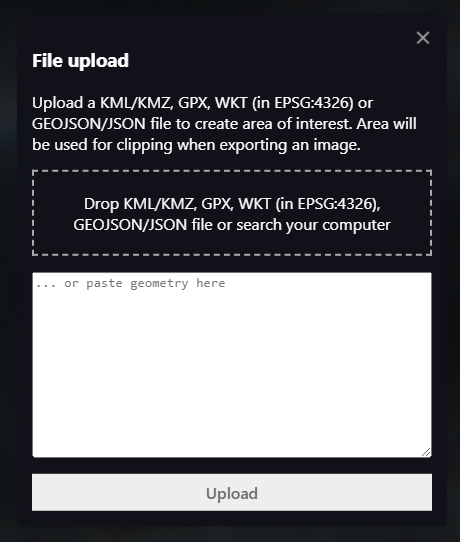
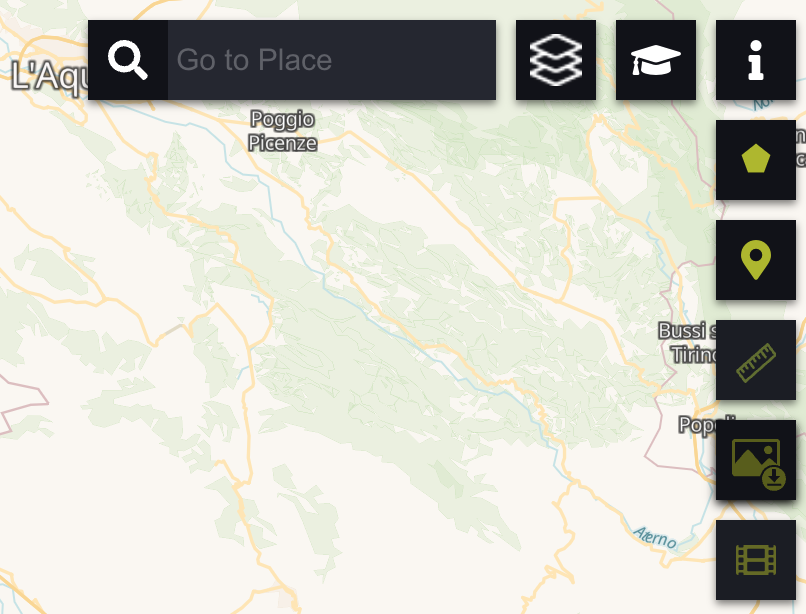
Hi it sounds like you are trying to plot a point and also a polyline in the same file? If using a geojson I don’t think this is possible, it either has to be a polyline or a point. You generally can’t mix the two datatypes together. In EO Browser you can either upload polygons or create points of interest with the tools in the top right of the application window:
Thank you. You understand me correctly. I’m trying to plot a point and a line.
I do understand that you can’t mix the types, so i try to plot them as polygons and it works.
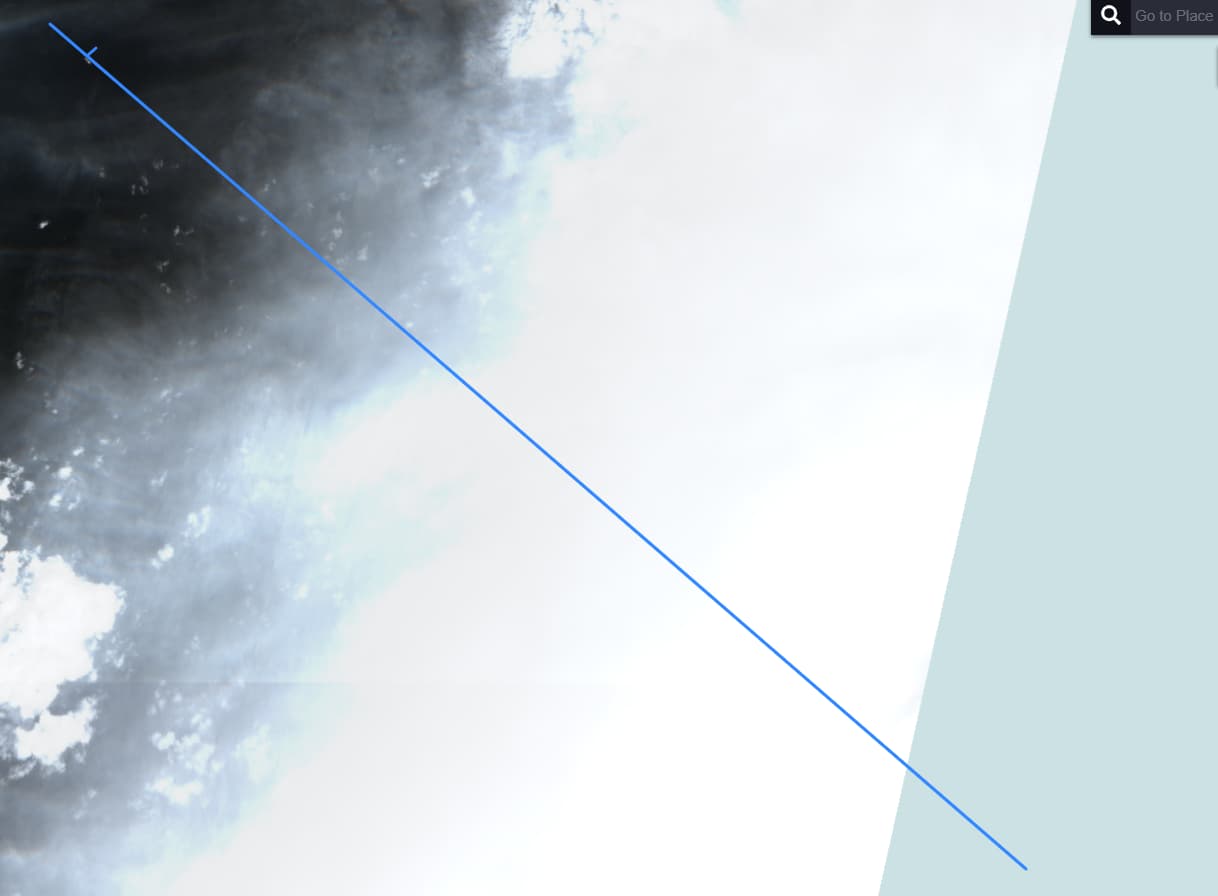
Issue is that i want to be able to see both of them at the same time, but i can only achieve one at a time (see below screenshots)
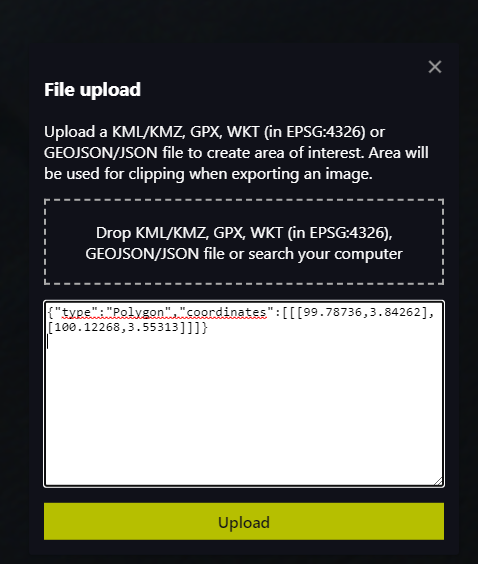
line {“type”:“Polygon”,“coordinates”:[[[99.78736,3.84262],[100.12268,3.55313]]]}
OK think I understand, I would recommend using something like Wicket to generate your polygons then copy the WKT into EO Browser. The example works well for me.
Thank you. This is exactly what i was trying to achieve.
I don’t understand how i couldn’t find the proper syntax for MULTIPOLYGON.
Tried now MULTIPOLYGON (((99.78736 3.84262 , 100.12268 3.55313)),((99.80011 3.83161 , 99.80311 3.83461))) and it worked perfectly (uses my coordinates + some magic numbers)