reutkeller
(Reut Keller)
1
I have created in my confiduration sentinel 1 layer by inserting the following script in the costum sccript editor:
return [VV,VH, 2 * VH, VV / VH / 100.0]
( like in the documentation + VH channel).
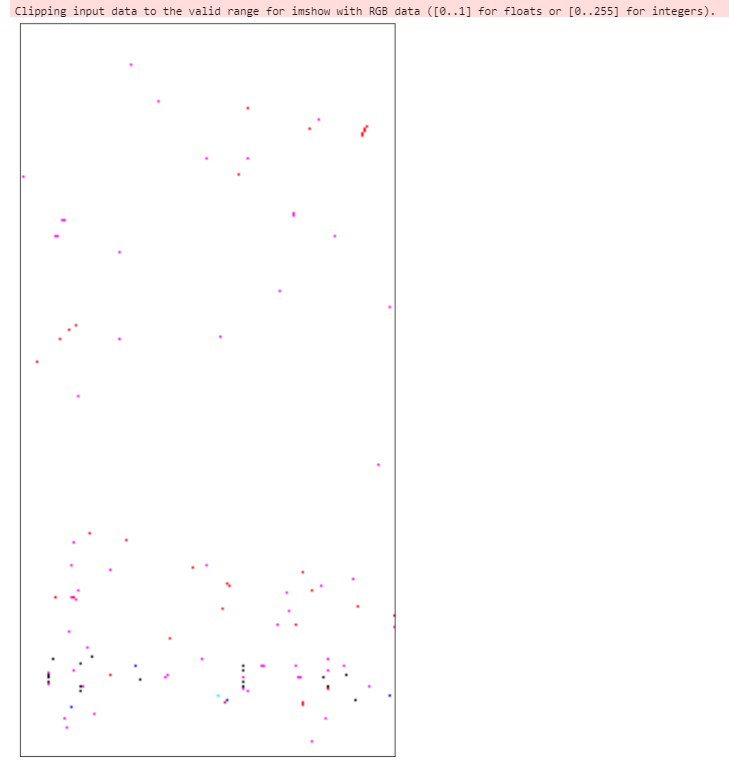
I used wms_Request and get data and then plot the image but I got image with dots :
 bbox_size,bbox,bbox_coords_wgs84=get_bbox_from_shape(shapes,10)


s1_request = WmsRequest(
    data_collection=DataCollection.SENTINEL1_IW,
    layer='TRUE-COLOR-S1-IW',
    bbox=bbox,
    time=('2020-11-01', '2021-01-10'),
    width=bbox_size[0],
    config=config
)

s1_data = s1_request.get_data()


plot_image(s1_data[-3])
I’m not sure why is this hapenning ans would love to understand it better and get help with hoe to solve it.
From your error, it seems that the values returned are outside the range that the function can plot (0-1 or 0-255).
Can you share your bbox to reproduce (because it works for me over some random bbox)?
reutkeller
(Reut Keller)
3
so the values 0-255 source is from the plot image fucntion? though also when I print the array I get 0-255 values
tthis is the bbox:
[-47.949734553694725,
-8.746513680257486,
-47.93459851294756,
-8.717573061584929]
Is your plot function the following?
def plot_image(image, factor=1):
    """
    Utility function for plotting RGB images.
    """
    fig = plt.subplots(nrows=1, ncols=1, figsize=(15, 7))

    if np.issubdtype(image.dtype, np.floating):
        plt.imshow(np.minimum(image * factor, 1))
    else:
        plt.imshow(image)
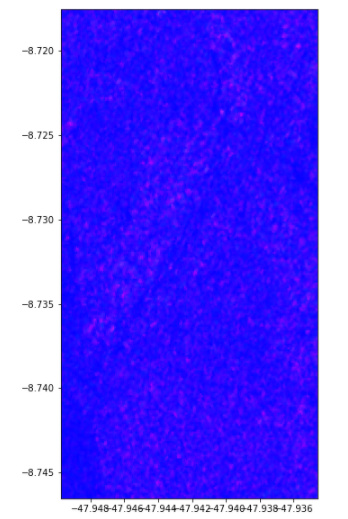
Because running over the BBox you gave me returns this:
reutkeller
(Reut Keller)
5
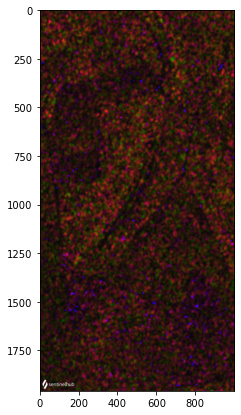
Is very weird, if I use the evaluate script with your plot_image function I get:
and if I use the WmsRequest it looks like this (same plot_image function):
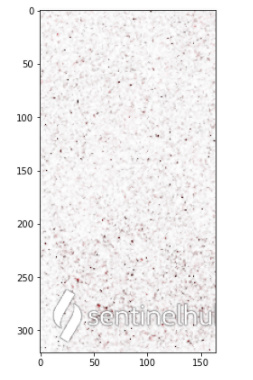
both values are in UINT8