Problem with Tiff Image boundary

Hello Team,
I have downloaded the sentinel-2 images and the raster image boundaries are having zigzag issues. The boundary of the image is not straight. I have attached the sample file as well.

Could you please help me out to get the smooth boundary images?

Hello and welcome @deepika.s,

Could you provide some more information about how you downloaded the Sentinel-2 images? Maybe you can send us the request you used?
I also cannot see the sample file you mentioned in your post, did you forget to attach it?

Cheers, Max

Hello Max,
Thank you for your response!
Here is the request I have used for downloading sentinel-2.

 return SentinelHubRequest(
                            data_folder=raw_path,
                            evalscript=evalscript_all_bands_l1c,
                            input_data=[
                                SentinelHubRequest.input_data(
                                    data_collection=DataCollection.SENTINEL2_L1C,
                                    time_interval=time_interval,
                                    mosaicking_order='leastCC',
                                )
                            ],
                            responses=[
                                SentinelHubRequest.output_response('default', MimeType.TIFF)
                            ],
                            geometry=full_geometry,
                            config=config,
                            resolution=(10.0,10.0)
                        )

I’m attaching the eval script as well.

evalscript_all_bands_l1c = """
    //VERSION=3
    function setup() {
        return {
            input: [{
                bands: ["B01","B02","B03","B04","B05","B06","B07","B08","B8A","B09","B10","B11","B12"],
                units: "DN",

            }],
            output: {
                bands: 13,
                sampleType: "FLOAT32"
            }
        };
    }

    function evaluatePixel(sample) {
        return [sample.B01,
                sample.B02,
                sample.B03,
                sample.B04,
                sample.B05,
                sample.B06,
                sample.B07,
                sample.B08,
                sample.B8A,
                sample.B09,
                sample.B10,
                sample.B11,
                sample.B12];
    }
"""

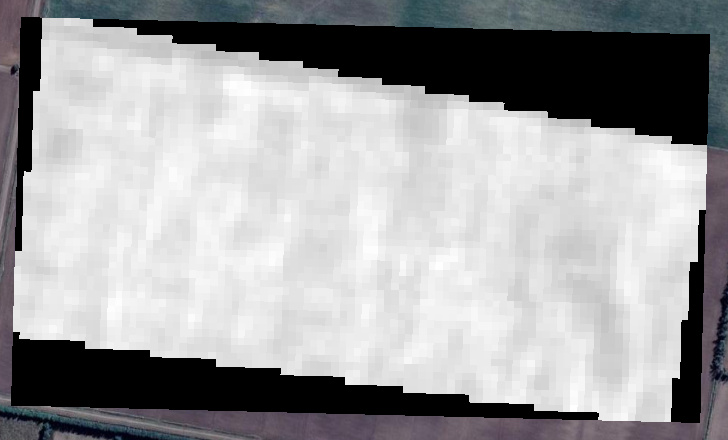
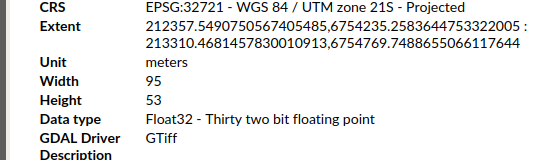
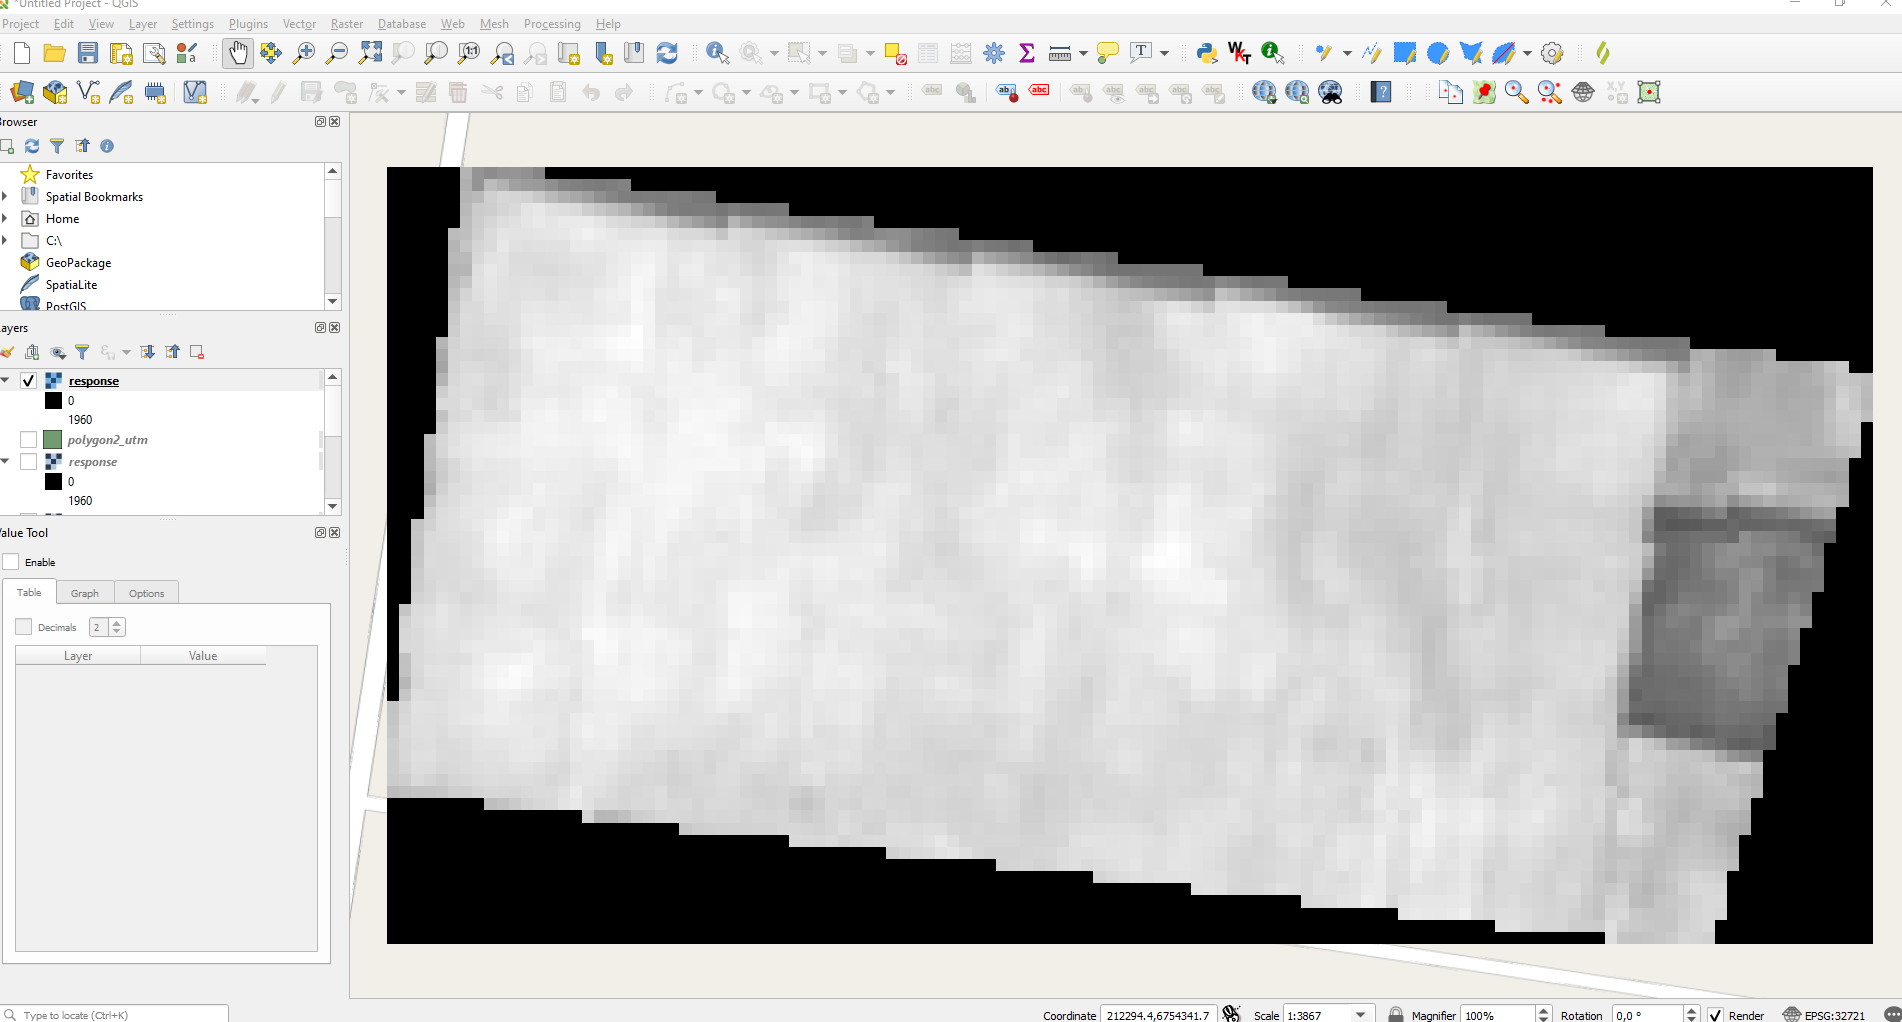
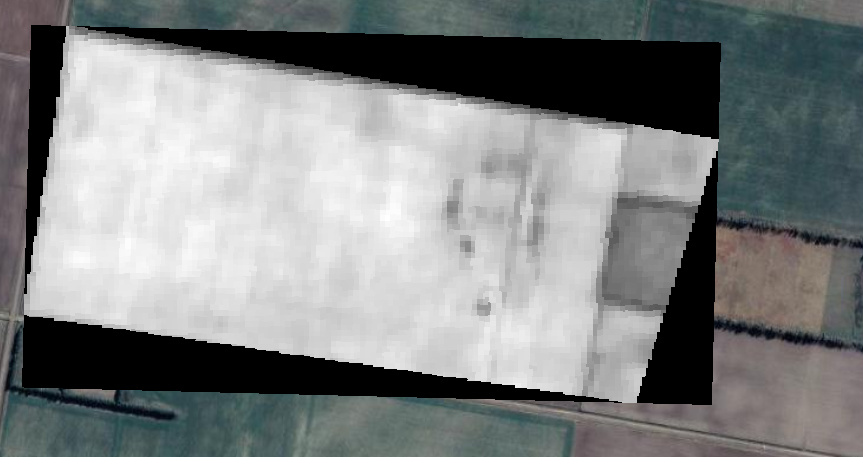
I couldn’t upload the image so I have pasted the screenshot of the image below

It is showing “New users can not upload attachments”.
Please give me access to upload the images.

Thanks,
Deepika

Hi Max,

I got access now. I have attached the file.
sentinel2_band4.tiff (20.0 KB)

Looking forward to your response!

Thanks,
Deepika

Hi again @deepika.s,

This looks like a typical mismatch of coordinate systems to me.

Which CRS is the geometry file in that you are using in the request? In which CRS are you trying to display the data in your GIS software? The file you provided is in UTM 21S (EPSG:32721).

Cheers, Max

Hi Max,

Yes, I have used the native EPSG code: 32721 (CRS) for downloading the file. I used the same to display the data in QGIS.

image
I have added the full_geometry code. Here I used UTM coordinates and native EPSG value.

full_geometry = Geometry(utm_zone_coordinates[‘data’][‘geojson’][‘geometry’], crs=Epsg_value)

EPSG code: 32721

UTM coordinates ={‘type’: ‘Polygon’, ‘coordinates’: [[[212396.6699745406, 6754769.748865507], [212357.54907505674, 6754336.958030145], [213261.5069435197, 6754235.258364475], [213310.468145783, 6754610.159376245], [212396.6699745406, 6754769.748865507]]]}

I have tried to download the files for different geometry with the larger size but I didn’t face this zigzag problem. I have this issue with smaller size images.

Thanks,
Deepika

Hi @deepika.s,

I created my own polygon in EPSG: 32721 (UTM zone 21S) in the AOI and inserted the coordinates into the following request and it works fine.

evalscript_all_bands_l1c = """
    //VERSION=3
    function setup() {
        return {
            input: [{
                bands: ["B04"],
                units: "DN",

            }],
            output: {
                bands: 1,
                sampleType: "FLOAT32"
            }
        };
    }

    function evaluatePixel(sample) {
        return [sample.B04];
    }
"""

geometry = Geometry(geometry={"type":"Polygon","coordinates":[ [ [ 212385.471988539473386, 6754760.278322491794825 ], [ 213536.804902656615013, 6754589.196724811568856 ], [ 213399.631369381590048, 6754125.272752723656595 ], [ 212320.738411038910272, 6754253.198632070794702 ], [ 212371.600507646508049, 6754623.104789216071367 ], [ 212385.471988539473386, 6754760.278322491794825 ] ] ]}, crs=CRS.UTM_21S)

request = SentinelHubRequest(
  data_folder='downloads',
  evalscript=evalscript_all_bands_l1c,
  input_data=[
    SentinelHubRequest.input_data(
        data_collection=DataCollection.SENTINEL2_L1C,
        time_interval=('2020-12-07', '2021-01-07'),
        mosaicking_order='leastCC'
    )
  ],
  responses=[
    SentinelHubRequest.output_response('default', MimeType.TIFF)    
  ],
  geometry=geometry,  
  resolution=(10.0,10.0),
  config=config
)
response = request.get_data(save_data=True) 

Here is the image displayed in QGIS and EPSG: 32721 (UTM zone 21S)

You could try to take my request as a template and further narrow down the error from there. Maybe your full_geometry is causing the problem.

I have been able to reproduce the “zigzag” effect only when I used the size parameter instead of resolution in the request body.

Cheers, Max

Hi Max,

I requested the same and got zigzag image when i used resolution parameter but zigzag was not there when i used size parameter. Please check the below image

But i have a resolution issue. Affline was not 10m, when i checked the meta data of the image. I have attached the meta data as well.

Meta Data:
{‘driver’: ‘GTiff’, ‘dtype’: ‘float32’, ‘nodata’: None, ‘width’: 256, ‘height’: 256, ‘count’: 1, ‘crs’: CRS.from_epsg(32611), ‘transform’: Affine(3.0509172172535273, 0.0, 293824.070457087,
0.0, -3.062021685502259, 5098436.604876635)}

Is there any way to pass ‘resolution’ and ‘size’ parameters together or any way to get 10m resolution?

Looking forward to hearing from you!

Thanks,
Deepika

Hi @deepika.s,

Your metadata states that your data is in UTM zone 11N (EPSG: 32611). Looking at the Area of interest UTM zone 21S (EPSG: 32721) should be the correct one.

Cheers, Max

Hi Max,

I’m sorry that I have attached the different image metadata previously.
Here is the correct metadata of band-4

{‘driver’: ‘GTiff’, ‘dtype’: ‘float32’, ‘nodata’: None, ‘width’: 256, ‘height’: 256, ‘count’: 1, ‘crs’: CRS.from_epsg(32721), ‘transform’: Affine(4.750259732881659, 0.0, 212320.7384110389,
0.0, -2.48049050690679, 6754760.278322492)}

Thanks,
Deepika

Hi @deepika.s ,

That is exactly what the resolution parameter is doing. The parameter units depend on the coordinate reference system. If you were to request data in a geographical CRS you’d have to define the resolution in degrees, whereas in a projected CRS like UTM you can enter the resolution in meters.

I adjusted my geometry with the coordinates you provided in one of your former posts and the API is returning the data in the specified resolution without the “zigzag” effect. You should retrieve the correct data with the following request:

evalscript_all_bands_l1c = """
    //VERSION=3
    function setup() {
        return {
            input: [{
                bands: ["B04"],
                units: "DN",

            }],
            output: {
                bands: 1,
                sampleType: "FLOAT32"
            }
        };
    }

    function evaluatePixel(sample) {
        return [sample.B04];
    }
"""

geometry = Geometry(geometry={"type":"Polygon","coordinates":[[[212396.6699745406, 6754769.748865507], [212357.54907505674, 6754336.958030145], [213261.5069435197, 6754235.258364475], [213310.468145783, 6754610.159376245], [212396.6699745406, 6754769.748865507]]]}, crs=CRS.UTM_21S)
request = SentinelHubRequest(
  data_folder='downloads',
  evalscript=evalscript_all_bands_l1c,
  input_data=[
    SentinelHubRequest.input_data(
        data_collection=DataCollection.SENTINEL2_L1C,
        time_interval=('2020-12-07', '2021-01-07'),    
        other_args = {"dataFilter":{"mosaickingOrder":"leastCC"}},
        mosaicking_order='leastCC'
    )
  ],
  responses=[
    SentinelHubRequest.output_response('default', MimeType.TIFF)    
  ],
  geometry=geometry,  
  resolution=(10.0,10.0),
  config=config
)
response = request.get_data(save_data=True) 

In case this doesn’t work for you, would you be willing to send me your whole code and required files in a private message?

Cheers, Max

Hi Max,

Currently, I’m facing 2 issues below

  1. It gives a 10 m resolution image if I pass the resolution parameter but the zigzag issue is there.
  2. It gives the image without zigzag issue if I pass the size parameter but the resolution is not 10m.

I could fix either the resolution issue or the zigzag issue.
The coordinate adjustment doesn’t work in my case as I need the exact coordinate image.

Could you please share your email ID to share my code?

Thanks,
Deepika