Hi all,
I’m having some problems with the NDVI value of some images I just downloaded. I transformed with QGIS the Tiff file downloaded from Sentinel Hub in a polygon. But here the value of NDVI are between 0.6 and 1 which is too high for this time of the season. Is there a specific process I should use to download this images/transform them in a polygon?
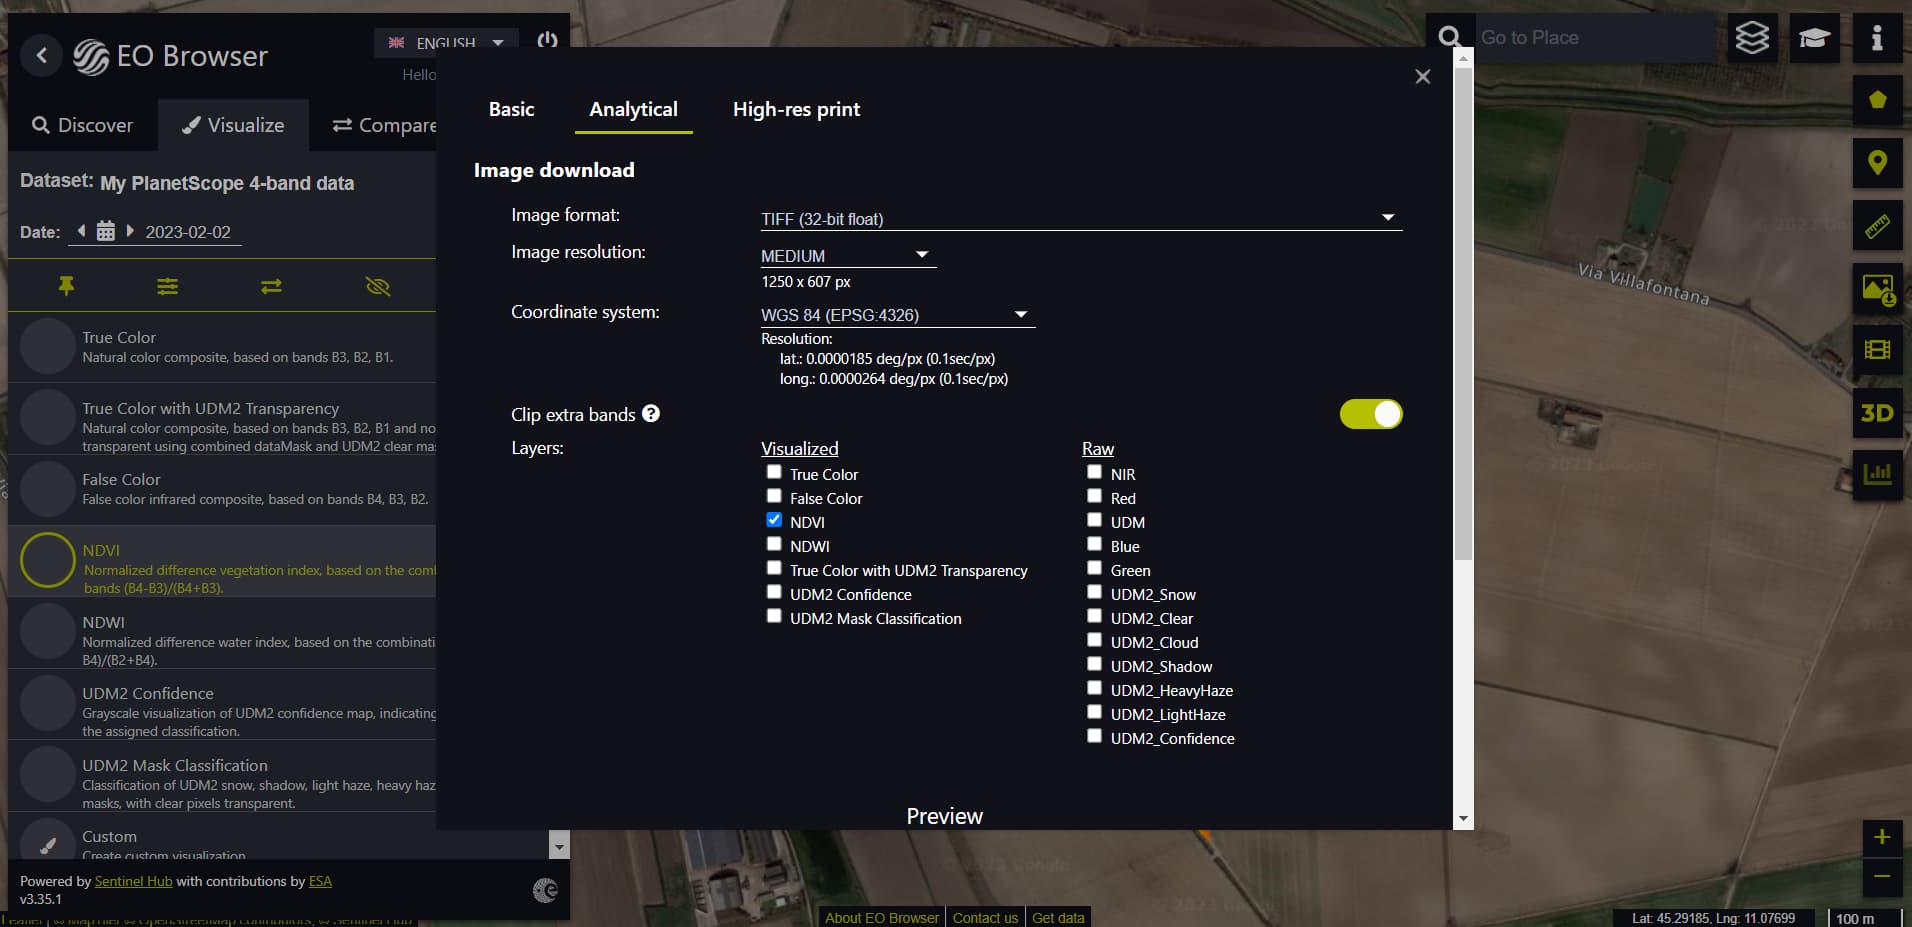
Here you can see the option I am using at the moment to download the Images.
The tool I use to generate the polygon is “Raster pixels to polygons”.
Thanks for your help.
You are actually downloading the “visualisation” of NDVI as you can see in your screenshot. To download the actual NDVI value, you need to set your own configuration with a proper layer, i.e., a layer that returns NDVI value as the output.
Here is a webinar that should give you a well introduction of EO Browser, and you can find a step-by-step instruction to create a configuration in the Create your own configurations section.
Hi @chung.horng’
I tried to create my own configuration as you suggested.
I followed the tutorial that can be found in FAQ.
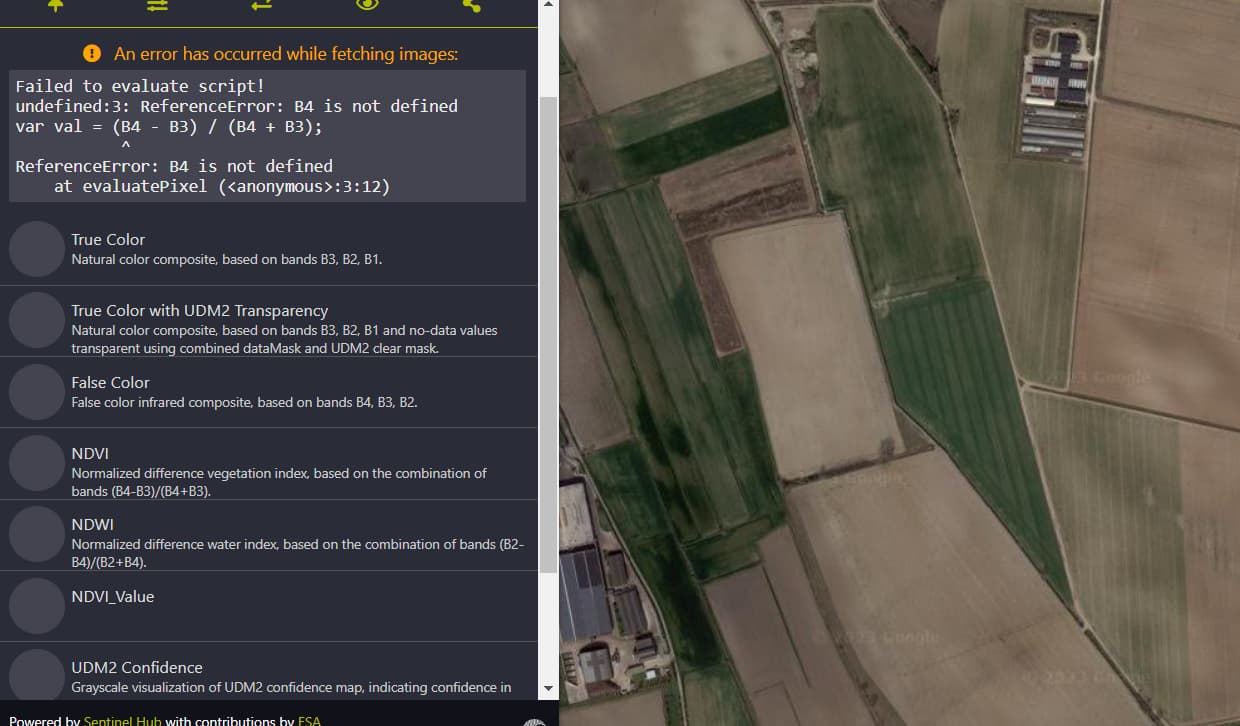
Then I selected the script for the Planet Scope NDVI that can be found here:
Sorry for the confusion. PlanetScope does not have B3 and B4 bands. The available bands are listed in our documentation. We will fix the example script in the custom script repository.
Since EO Browser is designed for visualisation, we need to manipulate the NDVI index a little bit so the index can fit into EO Browser. The idea is that we multiply the index by 10000 and add 10000 to make the index range from 0 to 20000. Please check out this blog post for more details.
Once the images are downloaded, you can easily rescale back to the range -1 to 1 by applying the following operation to your image: ndvi_float = (ndvi-10000)/10000.
function evaluatePixel(sample) {
let ndwi = index(sample.NIR , sample.Green);
return [10000 * ndwi+ 10000];
So the layer will be something like this and to calculate the real value of the index on QGIS my formula will be: ndwi_float = (ndwi-10000)/10000 .
Am I right?