I am working with sentinel 1 data from the AWS s3 bucket, to which I get the following files as output:
“GRD/2020/1/30/IW/DV/S1B_IW_GRDH_1SDV_20200130T104225_20200130T104250_020045_025EDF_152C/”
calibration-iw-vh.xml
calibration-iw-vv.xml
iw-vh.tiff
iw-vh.xml
iw-vv.tiff
iw-vv.xml
manifest.safe
noise-iw-vh.xml
noise-iw-vv.xml
quick-look.png
I need to extract a region of interest from the image(map), however when I load “iw-vv.tiff” with the gdal library, it does not give me information dataset.GetProjection(), nor dataset.GetGeoTransform() to be able to process it as GeoTif and obtain my region of interest. I can modify dataset.GetGeoTransform() by the data obtained from: items[0].properties[‘proj:transform’]… I have not been able to find clear information about how to process the images that way or if there is an easier way. Here is some of the code I have used.
client = Client.open(“https://earth-search.aws.element84.com/v1”)
collection = “sentinel-1-grd”
tas_bbox = [-74.2294, 4.6627015, -74.18812, 4.7040215]
search = client.search(collections=[collection],
bbox=tas_bbox,
datetime=“2020-01”)
items = list(search.items())
print(f"Found: {len(items):d} datasets")
stac_json =search.item_collection_as_dict()
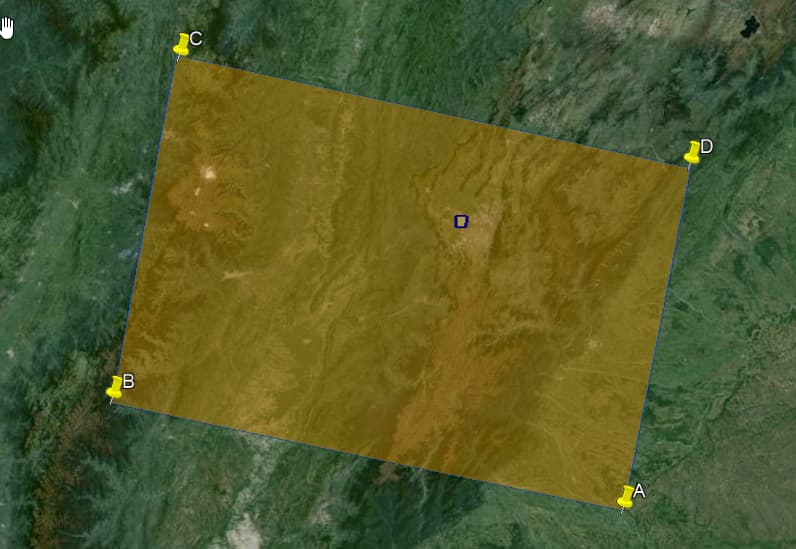
Here there are an image to explain better that I want to do:
The orange square is the complete image “iw-vv.tiff” [3.388897,-73.497696 3.861878,-75.753693 5.373992,-75.466370 4.905517,-73.205338] but all I only need is the small square in the middle of it [-74.2294, 4.6627015, -74.18812, 4.7040215].
Thank you very much
Hi @jpsuarezq54 ,
Sentinel Hub Processing API is designed for this kind of tasks. You can make a request for your area of interest instead of downloading the entire tile and clipping your area of interest from it.
I tried but It did not work, it returns zero values. I use this evalscript that it’s the same to request inside the page.
evalscript_prueba= “”"
//VERSION=3
function setup() {
return {
input: [“VV”, “VH”, “dataMask”],
output: { bands: 4 }
};
}
function evaluatePixel(sample) {
return [sample.VV / 0.28,
sample.VH / 0.06,
sample.VH / sample.VV / 0.49,
sample.dataMask];
}
“”"
def get_prueba(time_interval):
return SentinelHubRequest(
evalscript=evalscript_all_data,
input_data=[
SentinelHubRequest.input_data(
data_collection=DataCollection.SENTINEL1_IW.define_from(
name=“s1iw”, service_url=“https://sh.dataspace.copernicus.eu”),
time_interval=time_interval,
mosaicking_order=None,
other_args={
“dataFilter”: {
“resolution”: “HIGH”,
“mosaickingOrder”: “mostRecent”,
“orbitDirection”: “DESCENDING”,
“polarizationn”:“DV”,
},
“processing”: {
“backCoeff”: “GAMMA0_ELLIPSOID”,
“orthorectify”: True,
“demInstance”: “COPERNICUS”,
“downsampling”:“NEAREST”,
“speckleFilter”: None,
},
},
)
],
responses=[
SentinelHubRequest.output_response(“default”, MimeType.PNG),
],
bbox=aoi_bbox,
size=aoi_size,
config=config,
)
it returns zero values
Hi @jpsuarezq54 ,
Have you tried this example request? At the first glance, I think you need to specify sampleType: "FLOAT32" and request for "image/tiff".
I change sampleType and tiff request but now return a NaN values. I was trying with the example but the code show me the next error
from oauthlib.oauth2 import BackendApplicationClient
from requests_oauthlib import OAuth2Session
# Your client credentials
client_id = "hello"
client_secret = "wo"

# Create a session
client = BackendApplicationClient(client_id=client_id)
oauth = OAuth2Session(client=client)

# Get token for the session
token = oauth.fetch_token(token_url='https://identity.dataspace.copernicus.eu/auth/realms/CDSE/protocol/openid-connect/token',
                          client_secret=client_secret, include_client_id=True)

# All requests using this session will have an access token automatically added
resp = oauth.get("...")
print(resp.content)
I find your answer here but don’t work
I get this error:
469         """Intercept all requests and add the OAuth 2 token if present."""
470         if not is_secure_transport(url):
→ 471 raise InsecureTransportError()
472 if self.token and not withhold_token:
473 log.debug(
InsecureTransportError: (insecure_transport) OAuth 2 MUST utilize https.
Could you please clarify the following:
I’m usign https://sh.dataspace.copernicus.eu and I have the both credentials.
With Sentinel Hub Dashboard result
(invalid_client) Invalid client or Invalid client credentials
And with copernicus
b’
503 Service Unavailable
\nNo server is available to handle this request.\n\n\n’
In this case, please follow the Copernicus Data Space Ecosystem Configuration and set the sh_client_id and sh_client_secret to your credentials created from the Copernicus Data Space Ecosystem Dashboard.
Please try to follow the example 1 of this example notebook and let me know if it works for you.
It’s work for me, I have this code
config = SHConfig()
config.sh_client_id = “Hello”
config.sh_client_secret = “W”
config.sh_token_url = “https://identity.dataspace.copernicus.eu/auth/realms/CDSE/protocol/openid-connect/token”
config.sh_base_url = “https://sh.dataspace.copernicus.eu”
config.save(“cdse”)
config = SHConfig(“cdse”)
aoi_coords_wgs84 = [-74.2294, 4.6627015, -74.18812, 4.7040215] #(lon1, lat1, lon2, lat2)
resolution = 3
aoi_bbox = BBox(bbox=aoi_coords_wgs84, crs=CRS.WGS84)
aoi_size = bbox_to_dimensions(aoi_bbox, resolution=resolution)
aoi_bbox = BBox(bbox=aoi_coords_wgs84, crs=CRS.WGS84)
print(f’Image shape at {resolution} m resolution: {aoi_size} pixels’)
And the example 1 work for me with Sentinel2 data but no with Sentinel1.
Great, you are authenticated now. Next, please try to make your Sentinel-1 request following the snippet below:
evalscript = """
//VERSION=3
function setup() {
  return {
    input: ["VV"],
    output: { id: "default", bands: 1, sampleType: SampleType.FLOAT32 },
  }
}

function evaluatePixel(samples) {
  return [samples.VV]
}
"""
bbox = BBox(bbox=[12.44693, 41.870072, 12.541001, 41.917096], crs=CRS.WGS84)

request = SentinelHubRequest(
    evalscript=evalscript,
    input_data=[
        SentinelHubRequest.input_data(
            data_collection=DataCollection.SENTINEL1_IW_DES.define_from("s1iw", service_url=config.sh_base_url),
            time_interval=('2024-01-26', '2024-02-26'),
            other_args={"dataFilter": {"resolution": "HIGH"},"processing": {"orthorectify": True,"demInstance": "COPERNICUS"}}
        ),
    ],
    responses=[
        SentinelHubRequest.output_response('default', MimeType.TIFF),
    ],
    bbox=bbox,
    size=[512, 343.697],
    config=config
)

response = request.get_data()
This should fix the issue.
I change
data_collection=DataCollection.SENTINEL1_IW_DES.define_from(“s1iw”, service_url=config.sh_base_url),
to
data_collection=DataCollection.SENTINEL1_IW_DES.define_from(“sd”, service_url=config.sh_base_url),
Idk how, I just try with anoher word
Because when I run the code, it shows me the next error:
ValueError: Data collection name s1iw is already taken by another data collection
But with the correction I get an response with values btw 0 and 100. How I can visualizate the image to know that it’s the correct AOI. I tried to normalize the data, but it’s difficult to see the image like the Browser Sentinel or Browser Copernicus. Visual to human eye, like a map.
The error message ValueError: Data collection name s1iw is already taken by another data collection simply means that s1iw has already been defined (probably with your previous execution).
Did you specify sampleType in your Evalscript? Values between 0 and 100 sound like a result of the default option sampleType: "AUTO" which stretches [0, 1] to [0, 255].
To visualise your data you can make use of matplotlib. Below is an example snippet.
import matplotlib.pyplot as plt

plt.imshow(response[0])
Yes, I specified sampleType as “AUTO” and now show me the image with values btw 0-255, perfect to see the AOI. I was using the matplotlib library with the previous example and the image looks weird, so looks like better with AUTO configuration.
Thanks very much for your assistance, i hope that the topic help a lot of people.
Glad that it works for you at the end. For the weird image, it could be a result of outlier as mentioned in the documentation. You could try to clip your data or specify vmax and vmin in the imshow method to get a proper visualisation.