Process API-Leaflet Multiple Evalscript

Hi,
I am trying to get NDVI and True Color layers on using Process API-leaflet. I’am student and I’ve just a basic knowledge and i am trying to develop sample process api-leaflet code. Sorry in advance.
The evalscript I applied for the True Color layer is not working. How can I directly use the layers I created in the dashboard without using evalscript or can I define 2 different evalscripts in my code?

Here is my code which works to get NDVI layer correctly.

    # Sentinel Hub OAuth2 + Process API Leaflet

    How to use:

      1) enter sentinelHubNDVI client ID and secret
         (go to SH Dashboard -> User settings -> OAuth clients -> "+")

      2) open this file in browser

  *************************/
  const CLIENT_ID = "a7b4fba9-cc9c-4fdb-9a15-MASKED";
  const CLIENT_SECRET = "Xr-F_M>hTi1O+3xUOEtPcKR-MASKED";

  const fromDate = "2020-07-01T00:00:00.000Z";
  const toDate = "2020-09-01T00:00:00.000Z";
  const dataset = "S2L1C";
  const evalscript = `//VERSION=3

//This script was converted from v1 to v3 using the converter API

//NDVI EVALSCRIPT
//VERSION=3

if (dataMask == 0) return [0,0,0,0];

//ndvi
var val = (B08-B04)/(B08+B04);

if (val<-1.1) return [0,0,0,1];
else if (val<-0.2) return [0.75,0.75,0.75,1];
else if (val<-0.1) return [0.86,0.86,0.86,1];
else if (val<0) return [1,1,0.88,1];
else if (val<0.025) return [1,0.98,0.8,1];
else if (val<0.05) return [0.93,0.91,0.71,1];
else if (val<0.075) return [0.87,0.85,0.61,1];
else if (val<0.1) return [0.8,0.78,0.51,1];
else if (val<0.125) return [0.74,0.72,0.42,1];
else if (val<0.15) return [0.69,0.76,0.38,1];
else if (val<0.175) return [0.64,0.8,0.35,1];
else if (val<0.2) return [0.57,0.75,0.32,1];
else if (val<0.25) return [0.5,0.7,0.28,1];
else if (val<0.3) return [0.44,0.64,0.25,1];
else if (val<0.35) return [0.38,0.59,0.21,1];
else if (val<0.4) return [0.31,0.54,0.18,1];
else if (val<0.45) return [0.25,0.49,0.14,1];
else if (val<0.5) return [0.19,0.43,0.11,1];
else if (val<0.55) return [0.13,0.38,0.07,1];
else if (val<0.6) return [0.06,0.33,0.04,1];
else return [0,0.27,0,1];

  `;

const evalscript1 = `//VERSION=3

                      //TRUE COLOR

//VERSION=3

let minVal = 0.0;
let maxVal = 0.4;

let viz = new HighlightCompressVisualizer(minVal, maxVal);

function evaluatePixel(samples) {
let val = [samples.B04, samples.B03, samples.B02];
val = viz.processList(val);
val.push(samples.dataMask);
return val;
}

function setup() {
return {
input: [{
bands: [
“B02”,
“B03”,
“B04”,
“dataMask”
]
}],
output: {
bands: 4
}
}
}
; // Promise which will fetch Sentinel Hub authentication token: const authTokenPromise = fetch( "https://services.sentinel-hub.com/oauth/token", { method: "post", headers: { "Content-Type": "application/x-www-form-urlencoded" }, body: grant_type=client_credentials&client_id=${encodeURIComponent(
CLIENT_ID
)}&client_secret=${encodeURIComponent(CLIENT_SECRET)}`,
}
)
.then((response) => response.json())
.then((auth) => auth[“access_token”]);

  // We need to extend Leaflet's GridLayer to add support for loading images through
  // Sentinel Hub Process API:
  L.GridLayer.SHProcessLayer = L.GridLayer.extend({
        createTile: function (coords, done) {
            const tile = L.DomUtil.create("img", "leaflet-tile");
            const tileSize = this.options.tileSize;
            tile.width = tileSize;
            tile.height = tileSize;
            const nwPoint = coords.multiplyBy(tileSize);
            const sePoint = nwPoint.add([tileSize, tileSize]);
            const nw = L.CRS.EPSG4326.project(
                this._map.unproject(nwPoint, coords.z)
            );
            const se = L.CRS.EPSG4326.project(
                this._map.unproject(sePoint, coords.z)
            );

            authTokenPromise.then((authToken) => {
                // Construct Process API request payload:
                //   https://docs.sentinel-hub.com/api/latest/reference/#tag/process
                const payload = {
                    input: {
                        bounds: {
                            bbox: [nw.x, nw.y, se.x, se.y], // a tile's bounding box
                            geometry: { // remove to disable clipping
                                type: "Polygon",
                                coordinates: [
      [
        [
          37.033538818359375,
          39.246745041633794
        ],
        [
          37.03388214111328,
          39.23777105285819
        ],
        [
          37.04864501953125,
          39.23836935449403
        ],
        [
          37.04804420471191,
          39.24754267396328
        ],
        [
          37.033538818359375,
          39.246745041633794
        ]
      ]
    ]
                            },
                            properties: {
                                crs: "http://www.opengis.net/def/crs/EPSG/0/4326",
                            },
                        },
                        data: [
                            {
                                dataFilter: {
                                    timeRange: {
                                        from: fromDate,
                                        to: toDate,
                                    },
									maxCloudCoverage: 10,
                                    mosaickingOrder: "mostRecent",
                                    
                                },
                                processing: {},
                                type: dataset,
                            },
                        ],
                    },
                    output: {
                        width: 512,
                        height: 512,
                        responses: [
                            {
                                identifier: "default",
                                format: {
                                    type: "image/png",


                                },
							
                            },
                        ],
                    },
                    evalscript: evalscript,
					evalscript1: evalscript1,
					
					
                };

                // Fetch the image:
                fetch("https://services.sentinel-hub.com/api/v1/process", {
                    method: "post",
                    headers: {
                        Authorization: "Bearer " + authToken,
                        "Content-Type": "application/json",
                        Accept: "*/*",
                    },
                    body: JSON.stringify(payload),
                })
                    .then((response) => response.blob())
                    .then((blob) => {
                        const objectURL = URL.createObjectURL(blob);
                        tile.onload = () => {
                            URL.revokeObjectURL(objectURL);
                            done(null, tile);
                        };
                        tile.src = objectURL;
                    })
                    .catch((err) => done(err, null));
            });
            return tile;
        },
    });

  L.gridLayer.shProcessLayer = function (opts) {
    return new L.GridLayer.SHProcessLayer(opts);
  };
  const sentinelHubNDVI = L.gridLayer.shProcessLayer();
  const sentinelHubTrueColor = L.gridLayer.shProcessLayer();
  
  // OpenStreetMap layer:
  let osm = L.tileLayer("http://{s}.tile.osm.org/{z}/{x}/{y}.png", {
    attribution:
      '&copy; <a href="http://osm.org/copyright">OpenStreetMap</a> contributors',});


  // configure Leaflet:


  let baseMaps = {
    OpenStreetMap: osm,
  };
  let overlayMaps = {
    "NDVI": sentinelHubNDVI,
"True": sentinelHubTrueColor,
    
  };

  let map = L.map("map", {
    center: [39.243276, 37.042575], // lat/lng in EPSG:4326
    zoom: 15,
    layers: [osm, sentinelHubNDVI],
    
  });
  L.control.layers(baseMaps, overlayMaps).addTo(map);
</script>
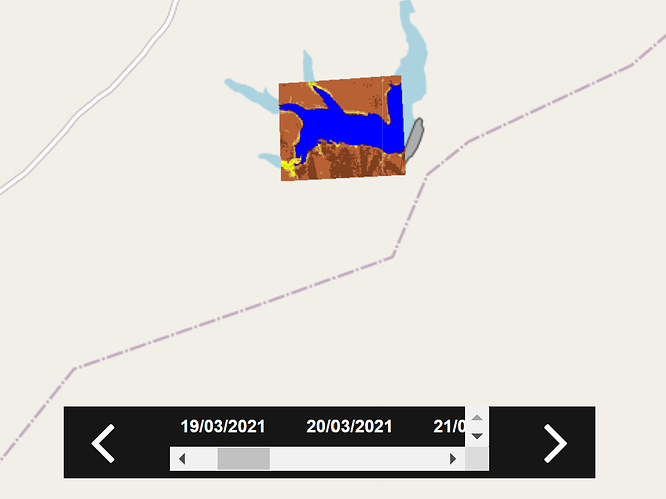
Hey, thanks for the question.
Sorry for the changes to your post, it was accidental. Now it should be the same as you first posted it.

You are very close to the correct solution.

The only change that is needed is to

  • pass the object with the evalscript to the ShProcessLayer when you are creating the layers

    • the passed object represents additional options for that ShProcessLayer and is merged with other options already accessible to it.
    const sentinelHubNDVI = L.gridLayer.shProcessLayer({evalscript: evalscript});
    const sentinelHubTrueColor = L.gridLayer.shProcessLayer({evalscript: evalscript1});
    
  • use the passed evalscript in the createTile function of the SHProcessLayer

    evalscript: this.options.evalscript,
    

Below, in the collapsible part, is the whole code with the comments, what I changed.

Side note - tips for markdown:
You can use triple backtick (``` ) followed by a new line for the start and end of the code block. This then has another option to set the syntax highlighting if you write the language after the start.

```html (or javascript, python, ...) 
... code 
```
The code (click to expand)
<html>
<head>
  <style>
    #map{
      width: 100vw;
      height: 100vh;
    }
  </style>
  <link rel="stylesheet" href="https://unpkg.com/leaflet@1.7.1/dist/leaflet.css"
    integrity="sha512-xodZBNTC5n17Xt2atTPuE1HxjVMSvLVW9ocqUKLsCC5CXdbqCmblAshOMAS6/keqq/sMZMZ19scR4PsZChSR7A=="
    crossorigin="" />
  <script src="https://unpkg.com/leaflet@1.7.1/dist/leaflet.js"
    integrity="sha512-XQoYMqMTK8LvdxXYG3nZ448hOEQiglfqkJs1NOQV44cWnUrBc8PkAOcXy20w0vlaXaVUearIOBhiXZ5V3ynxwA=="
    crossorigin=""></script>
</head>
</body>

<div id="map"></div>

<script>
  /*************************

  !!! EVERYTHING ABOVE THIS IS AN ASSUMPTION !!!
  Because Markdown treats html tags as formatting if they are not encapsed with triple ` (backtick)).
  Also, I added just the <link ...> and <script src="..." /> tags for Leaflet.
  
  # Sentinel Hub OAuth2 + Process API Leaflet

  How to use:

    1) enter sentinelHubNDVI client ID and secret
      (go to SH Dashboard -> User settings -> OAuth clients -> "+")

    2) open this file in browser

  *************************/
  const CLIENT_ID = "e613dced-c8db-MASKED";
  const CLIENT_SECRET = "jJ#T3bI/K3|JAJq7DsU_MASKED";

  const fromDate = "2020-07-01T00:00:00.000Z";
  const toDate = "2020-09-01T00:00:00.000Z";
  const dataset = "S2L1C";
  const evalscript = `//VERSION=3
    //This script was converted from v1 to v3 using the converter API

    //NDVI EVALSCRIPT

    if (dataMask == 0) return [0,0,0,0];

    //ndvi
    var val = (B08-B04)/(B08+B04);

    if (val<-1.1) return [0,0,0,1];
    else if (val<-0.2) return [0.75,0.75,0.75,1];
    else if (val<-0.1) return [0.86,0.86,0.86,1];
    else if (val<0) return [1,1,0.88,1];
    else if (val<0.025) return [1,0.98,0.8,1];
    else if (val<0.05) return [0.93,0.91,0.71,1];
    else if (val<0.075) return [0.87,0.85,0.61,1];
    else if (val<0.1) return [0.8,0.78,0.51,1];
    else if (val<0.125) return [0.74,0.72,0.42,1];
    else if (val<0.15) return [0.69,0.76,0.38,1];
    else if (val<0.175) return [0.64,0.8,0.35,1];
    else if (val<0.2) return [0.57,0.75,0.32,1];
    else if (val<0.25) return [0.5,0.7,0.28,1];
    else if (val<0.3) return [0.44,0.64,0.25,1];
    else if (val<0.35) return [0.38,0.59,0.21,1];
    else if (val<0.4) return [0.31,0.54,0.18,1];
    else if (val<0.45) return [0.25,0.49,0.14,1];
    else if (val<0.5) return [0.19,0.43,0.11,1];
    else if (val<0.55) return [0.13,0.38,0.07,1];
    else if (val<0.6) return [0.06,0.33,0.04,1];
    else return [0,0.27,0,1];
  `;

  const evalscript1 = `//VERSION=3
    //TRUE COLOR

    let minVal = 0.0;
    let maxVal = 0.4;

    let viz = new HighlightCompressVisualizer(minVal, maxVal);

    function evaluatePixel(samples) {
      let val = [samples.B04, samples.B03, samples.B02];
      val = viz.processList(val);
      val.push(samples.dataMask);
      return val;
    }

    function setup() {
      return {
        input: [{
          bands: [
            "B02",
            "B03",
            "B04",
            "dataMask"
          ]
        }],
        output: {
          bands: 4
        }
      }
    }
  `;

  // Promise which will fetch Sentinel Hub authentication token:
  const authTokenPromise = fetch(
    "https://services.sentinel-hub.com/oauth/token",
    {
      method: "post",
      headers: { "Content-Type": "application/x-www-form-urlencoded" },
      body: `grant_type=client_credentials&client_id=${encodeURIComponent(
        CLIENT_ID
      )}&client_secret=${encodeURIComponent(CLIENT_SECRET)}`,
    }
  )
  .then((response) => response.json())
  .then((auth) => auth["access_token"]);

  // We need to extend Leaflet's GridLayer to add support for loading images through
  // Sentinel Hub Process API:
  L.GridLayer.SHProcessLayer = L.GridLayer.extend({
    createTile: function (coords, done) {
      const tile = L.DomUtil.create("img", "leaflet-tile");
      const tileSize = this.options.tileSize;
      tile.width = tileSize;
      tile.height = tileSize;
      const nwPoint = coords.multiplyBy(tileSize);
      const sePoint = nwPoint.add([tileSize, tileSize]);
      const nw = L.CRS.EPSG4326.project(
        this._map.unproject(nwPoint, coords.z)
      );
      const se = L.CRS.EPSG4326.project(
        this._map.unproject(sePoint, coords.z)
      );

      authTokenPromise.then((authToken) => {
        // Construct Process API request payload:
        //   https://docs.sentinel-hub.com/api/latest/reference/#tag/process
        const payload = {
          input: {
            bounds: {
              bbox: [nw.x, nw.y, se.x, se.y], // a tile's bounding box
              geometry: { // remove to disable clipping
                type: "Polygon",
                coordinates: [
                  [
                    [
                      37.033538818359375,
                      39.246745041633794
                    ],
                    [
                      37.03388214111328,
                      39.23777105285819
                    ],
                    [
                      37.04864501953125,
                      39.23836935449403
                    ],
                    [
                      37.04804420471191,
                      39.24754267396328
                    ],
                    [
                      37.033538818359375,
                      39.246745041633794
                    ]
                  ]
                ]
              },
              properties: {
                crs: "http://www.opengis.net/def/crs/EPSG/0/4326",
              },
            },
            data: [
              {
                dataFilter: {
                  timeRange: {
                    from: fromDate,
                    to: toDate,
                  },
                  maxCloudCoverage: 10,
                  mosaickingOrder: "mostRecent",    
                },
                processing: {},
                type: dataset,
              },
            ],
          },
          output: {
            width: 512,
            height: 512,
            responses: [
              {
                identifier: "default",
                format: {
                  type: "image/png",
                },
              },
            ],
          },
          evalscript: this.options.evalscript, // CHANGED: using the evalscript that was passed 
        };

        // Fetch the image:
        fetch("https://services.sentinel-hub.com/api/v1/process", {
          method: "post",
          headers: {
            Authorization: "Bearer " + authToken,
            "Content-Type": "application/json",
            Accept: "*/*",
          },
          body: JSON.stringify(payload),
        })
        .then((response) => response.blob())
        .then((blob) => {
            const objectURL = URL.createObjectURL(blob);
            tile.onload = () => {
                URL.revokeObjectURL(objectURL);
                done(null, tile);
            };
            tile.src = objectURL;
        })
        .catch((err) => done(err, null));
      });
      return tile;
    },
  });

  L.gridLayer.shProcessLayer = function (opts) {
    return new L.GridLayer.SHProcessLayer(opts);
  };

  // CHANGED: passed the object with the correct evalscript to the L.gridLayer.shProcessLayer
  const sentinelHubNDVI = L.gridLayer.shProcessLayer({evalscript: evalscript});
  const sentinelHubTrueColor = L.gridLayer.shProcessLayer({evalscript: evalscript1});
    
  // OpenStreetMap layer:
  let osm = L.tileLayer("http://{s}.tile.osm.org/{z}/{x}/{y}.png", {
    attribution: '&copy; <a href="http://osm.org/copyright">OpenStreetMap</a> contributors'
  });

  // configure Leaflet:
  let baseMaps = {
    OpenStreetMap: osm,
  };
  let overlayMaps = {
    "NDVI": sentinelHubNDVI,
    "True": sentinelHubTrueColor,
  };

  let map = L.map("map", {
    center: [39.243276, 37.042575], // lat/lng in EPSG:4326
    zoom: 15,
    layers: [osm, sentinelHubNDVI],
  });
  L.control.layers(baseMaps, overlayMaps).addTo(map);
</script>
</body>
</html>

Hope this helps. Good luck!

Cheers

1 Like

Here’s a bit broader explanation.

The createTile function prepares the payload for the POST request to the Processing API for each tile that is displayed.
Processing API can only accept one evalscript per request. It then uses that evalscript and processes the data and sends a response. So, adding both evalscripts in the payload does not have a desired effect.

What we want to do, is to have a control from the outside of the L.gridLayer.shProcessLayer to set what evalscript should be used. We achieve that by sending an object with options (parameters with which the L.gridLayer.shProcessLayer is then created).
For more advanced use, other parameters can be set in the same way (fromDate, toDate, dataset, the coordinates for the bounds, maxCloudCoverage, mosaickingOrder, response format, etc.), but that’s maybe too advanced for this basic example.

1 Like

Dear Ziga,
Thank you so much for explaining everything in detail and editing the code. I am also researching advanced usage suggestions, I will try to implement it, and thank you for that too!

1 Like

Hey Ziga, I have one more question for you. I would like to list all available dates that were taken images up to 3 months prior to today’s date and apply NDVI to the selected date. I know that there is a distinct function in the Catalog API for this. How can I integrate this function into my process api-leaflet code?

Hey, sorry for late response.

The example below contains code and some explanation of how to use Catalog API.
I didn’t include the code for adding the dates into a DOM element as it makes the example quite long.
The element can be a simple div placed and designed as desired (the only thing is that the z-index should be above what the Leaflet elements z-index is, so that the element is visible (Leaflet has z-index value set to 1000 if I remember correctly).
Or it can also be a custom Control element.

I took the approach with async and await in some places as it is a bit easier to do for me than with the .then() and callbacks.

/*
  Same as in the example above
*/

// Promise which will fetch Sentinel Hub authentication token:
const authTokenPromise = fetch(
  "https://services.sentinel-hub.com/oauth/token",
  {
    method: "post",
    headers: { "Content-Type": "application/x-www-form-urlencoded" },
    body: `grant_type=client_credentials&client_id=${encodeURIComponent(
      CLIENT_ID
    )}&client_secret=${encodeURIComponent(CLIENT_SECRET)}`,
  }
)
  .then((response) => response.json())
  .then((auth) => auth["access_token"]);

/*
  Added
  Getting dates
*/

async function getDates(bbox, fromTime, toTime, collection) {
  try {
    const authToken = await authTokenPromise;

    // The catalog responses are paginated (max 100 features / dates returned at once).
    // We need to make multiple requests, each one requesting another "page" of dates.  
    // - check if 'next' field is present in 'context' part of the response,
    // - if it's present, set the 'next' field in our payload to that value and make another request
    // - if it's not present, don't make any more requests

    let payload = {
      "bbox": bbox,
      "datetime": fromTime + "/" + toTime,
      "collections": [collection],
      "limit": 50,
      "distinct": "date",
    };
    let moreResults = true;
    let allDates = [];

    while (moreResults) {
      const response = await fetch("https://services.sentinel-hub.com/api/v1/catalog/search", {
        method: "post",
        headers: {
          Authorization: "Bearer " + authToken,
          "Content-Type": "application/json",
          Accept: "*/*",
        },
        body: JSON.stringify(payload),
      });

      const data = await response.json();
      if (data.context.next) {
        moreResults = true;
        payload.next = data.context.next;
      } else {
        moreResults = false;
      }
      // Dates are returned in the 'features' part of the response.
      // They are ordered from the oldest to the newest date.
      allDates.push(...data.features);
    }

    return allDates;
  }
  catch (err) {
    console.error(err);
  }
}

const bboxForDates = [36, 38, 37, 39]; // bbox that encloses the same geometry as on the map
// bbox can also be retrieved / calculated from the current view on the leaflet map with some additional changes
const fromDateForDates = '2021-01-01T00:00:00Z';
const toDateforDates = '2021-03-29T23:59:59Z';
const collectionForDates = "sentinel-2-l1c"; // this is similar to dataset in the Process API request 

getDates(bboxForDates, fromDateForDates, toDateforDates, collectionForDates).then(dates => {
  // dates are now in ascending order (from older to newer)
  console.log("all the dates for the parameters, older first", { dates });

  // .sort() sorts in-place, so we need to first copy the array into a new one and then sort
  const datesFromNewerToOlder = [...dates].sort((a, b) => (new Date(b).getTime() - new Date(a).getTime()));
  console.log('all the dates for the parameters, newer first', { datesFromNewerToOlder });
  
  // use the dates - put the dates in some DOM element, etc.
});

Hope this helps.
Cheers, Ziga

1 Like

How do I go about this same implementation using the sentinel hub python for Process API’s
I am creating a service and so I have an endpoint
localhost:8000/farm/ndvi/?geometry=#shape file
for now I am using a fixed shape file
everything works fine here when I test with post man but how can the front end team use this with leaflet

class vegetativeIndexView(APIView):
    def get(self, request):
        # Credentials

        CLIENT_ID = 'client_id'
        CLIENT_SECRET = 'secrete'
        config = SHConfig()

        if CLIENT_ID and CLIENT_SECRET:
            config.sh_client_id = CLIENT_ID
            config.sh_client_secret = CLIENT_SECRET
        else:
            config = None

        evalscript = """
            //VERSION=3
            function setup() {
                return {
                        input: [{
                        bands:["B04", "B08", "B02", "dataMask"],
                        }],
                        output: {
                        id: "default",
                        bands: 4,
                        }
                    };
                }


            function evaluatePixel(sample, scenes) {
                let ndvi = (sample.B08 - sample.B04) / (sample.B08 + sample.B04)
                if (sample.dataMask == 1){
                    
                    
                    if (ndvi<-0.5) return [0.05,0.05,0.05, 1]
                    else if (ndvi<-0.2) return [0.75,0.75,0.75, 1]
                    else if (ndvi<-0.1) return [0.86,0.86,0.86, 1]
                    else if (ndvi<0) return [0.92,0.92,0.92, 1]
                    else if (ndvi<0.025) return [1,0.98,0.8, 1]
                    else if (ndvi<0.05) return [0.93,0.91,0.71, 1]
                    else if (ndvi<0.075) return [0.87,0.85,0.61, 1]
                    else if (ndvi<0.1) return [0.8,0.78,0.51, 1]
                    else if (ndvi<0.125) return [0.74,0.72,0.42, 1]
                    else if (ndvi<0.15) return [0.69,0.76,0.38, 1]
                    else if (ndvi<0.175) return [0.64,0.8,0.35, 1]
                    else if (ndvi<0.2) return [0.57,0.75,0.32, 1]
                    else if (ndvi<0.25) return [0.5,0.7,0.28, 1]
                    else if (ndvi<0.3) return [0.44,0.64,0.25, 1]
                    else if (ndvi<0.35) return [0.38,0.59,0.21, 1]
                    else if (ndvi<0.4) return [0.31,0.54,0.18, 1]
                    else if (ndvi<0.45) return [0.25,0.49,0.14, 1]
                    else if (ndvi<0.5) return [0.19,0.43,0.11, 1]
                    else if (ndvi<0.55) return [0.13,0.38,0.07, 1]
                    else if (ndvi<0.6) return [0.06,0.33,0.04, 1]
                    else if (ndvi==0) return [1, 1, 1, 1]
                    else return [0,0.27,0, 1]
                }
                else{
                    return [1, 1, 1, 0]
                } 
                } 
                    
        """

        geometry = Geometry(
            geometry={
                "type": "Polygon",
                "coordinates": [
                    [
                        [6.630955, 12.001712],
                        [6.987991, 12.044693],
                        [7.136298, 11.684514],
                        [6.576026, 11.482716],
                        [6.394761, 11.773259],
                        [6.630955, 12.001712],
                    ]
                ],
            },
            crs=CRS.WGS84,
        )

        request = SentinelHubRequest(
            evalscript=evalscript,
            input_data=[
                SentinelHubRequest.input_data(
                    data_collection=DataCollection.SENTINEL2_L2A,
                    time_interval=('2021-04-22', '2021-05-22'),
                )
            ],
            responses=[
                SentinelHubRequest.output_response('default', MimeType.PNG),
            ],
            geometry=geometry,
            size=[512, 395.946],
            config=config,
        )
        response = request.get_data()[0]

        return Response(response, status=status.HTTP_200_OK, content_type='image/png')

Hey, the whole thing depends on how you want your frontend to behave and look like.
By the URL and the other forum post, I assume that one of the goals is to let user create a geometry and get back the image for that geometry and the other is displaying the image(s) in the interactive map.

Some explanation for the options below:
The way leaflet works, is that it divides the plane on which it displays the data into smaller tiles. Only a small section of this plane is displayed on the screen. Leaflet then requests an image for each tile that is visible on the screen from the backend. Leaflet also divides the plane differently for each zoom level and requests appropriate images for them.

Below are described 3 different options that I thought of:

  • The first easy solution, using your backend, is:

    • [frontend] use leaflet just to draw a geometry on the map and then send it to the backend
    • [backend] get geometry, (do what needs to be done), return image for the geometry
    • [frontend] display static image in the <img> element

    The drawback is that the image would be static and would not be displayed on the interactive map.

  • The second easy solution is to use Sentinel Hub services in leaflet on the frontend directly.
    That way, the user could draw a geometry on the leaflet map (which would then be sent to Sentinel Hub when requesting images for leaflet).
    Also the images would be displayed on the interactive map and users would get appropriate images for the zoom levels they are viewing.
    The drawback here is not using your backend to get the images (if you do any additional post-processing on the images, but this can be moved to frontend, if necessarry). Backend could still be used to authenticate users and other things not related to getting the images.

  • The way that would use your backend and display the images on the leaflet is:

    • [frontend] extend a leaflet Layer class in a similar way it is done above, change createTile() so that it sends to the backend all the info that is needed to make a request with sentinelhub-py (CRS, bbox, date, geometry, and potentially some others if users will have an option to change between visualizations and collections)
    • [frontend] point the leaflet to call your backend
    • [backend] use the info from the frontend to get the image, (do what needs to be done), return the image

    Drawback here is that this will probably be slower than using Sentinel Hub directly in the leaflet on the frontend.

This is meant as a more high-level look at the whole thing. I think this is already long enough, but I can go more into details in another reply.

If you are ready to share a bit more information of what you are trying to create, we can provide some more insight, which way is doable and which way is not worth the effort.

Hope this gives you some help.
Cheers.

Hello …@z.cern

Thanks for your prompt response, it is quite enlightening.

Based on you suggestion, we will like to go for the second option cos of the obvious advantage which you have stated.

after much consideration the second option is what I and the team are considering

The concept I’m trying to build is that :

  • Users can load polygon of diff formats ( shapefile, geojson or kml) or draw and visualize index (ndvi or ndwi) on the leaflet map. User can see historical indices and visualize the graph. How do we go about this? Thanks

  • ability to upload a shape file and be processed is a major thing I want to explore

I will appreciate if you can give me a template to work with and shed some more light on the chosen path

Hey,
sorry for the delayed answer.

Most of the things are done in some way or another in EO Browser, which is an open source project, available on Github, so I will link them here for help.
EO Browser also heavily depends on sentinelhub-js, which is meant to simplify the work with Sentinel Hub services in EO Browser and similar web applications.

Uploading and reading / processing the kml and geojson files is done in EOBUploadGeoFile.js. It uses a couple of libraries to correctly parse the content of the kml or geojson files. When that is done, we create a new layer with the data from the file and focus the map on the bounding box of the uploaded geometries in onFileUpload function.

Dealing with shape files can probably be solved with shapefile npm package.

After the successful uploading of the file, you can trigger getting the NDVI images automatically or through a button which the user clicks.

There are a lot of libraries for drawing on the leaflet map - one of them is Leaflet Draw. Here, the flow would be similar - first the user would draw the polygon and then confirm that they finished / click the button to get the images.

For selecting different dates a simple datepicker can be used. After selecting the date, just update the date for the layer and leaflet will update the displayed images.

For creating a graph, EO Browser uses semiotic library for React, but any other library is good enough.
Getting the data can be done through our fairly new Statistical API or through our FIS service.
Unfortunately I don’t have a good example for that, so I’m pointing to parts of EO Browser again.
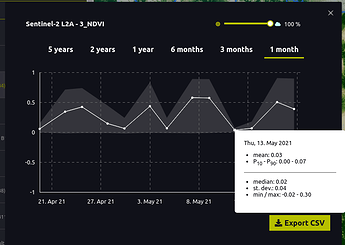
FIS.js and FIS.utils.js might be of help - EO Browser uses FIS service and shows the mean value and area between 10th and 90th percentile on the graph, alongside with the other values that come from the FIS service as a popup tooltip.

Edit: Adding links to simpler demos / boilerplates:

You can take parts of the code from each to get you started.

Hope this helps you make a few steps forward.
Cheers

Thank you so much @z.cern I will start working with this and update you