I´m trying to see an index derived from a configuration utility in QGIS using the SH Plugin. The visualization works well except for an specific date (2021-02-05) when only one of the polygons shows the index. Any other date would work as it can be seen in the left image where the 5 polygons show the index. I tried to move the minimum and maximum values to be shown but it did not work. What can be the issue here? Thanks.

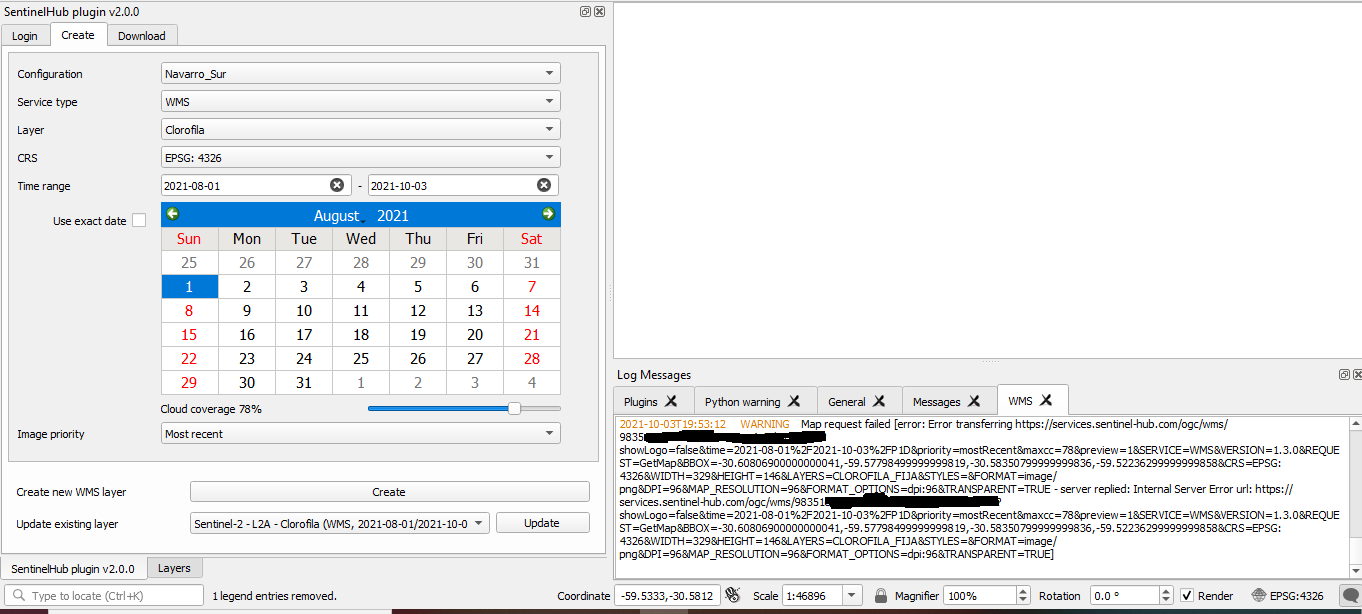
Can you install Network logger plug-in and provide the request URLs that are triggered? (do mask second half of insance ID to prevent from abuse).
My first guess would be that you are looking at the area where two Sentinel-2 scenes are stitched together and either the upper one is missing or it has a cloud coverage higher than what your configuration allows for.
Thanks.
It is in fact a zone where two images overlap. It seems that It doesn´t work for any date, regardless cloud coverage. I don´t understand how to use Network logger plug-in, what else can be done?
Hi @minian.matias,
Thank you for the additional information (we hid the sensitive information in your screenshot). The team at Sentinel Hub is looking into it and will get back to you soon.
After investigation it seems that the geometry that you are using is invalid: you have a collection of polygons and one of them has a self-intersection at (-59.54325890506279, -30.591331084504386).
Would you mind trying with simpler polygons or try cleaning your existing set and trying again please?
Thanks @maxim.lamare maxim!!! It was that, and I didn´t see it before.