I’ve been using EO-browser for a couple of months now. It’s pretty cool how you can access different satellites and get various information.
At the moment I’m stuck in reading the values for a specific color. I need some reference values. So for instance, if I’m using Sentinel 5P and checking for NOX gasses, I would like to have some reference values for toxicity.
I’m guessing that the colors are based on a linear scale and that it doesn’t correlate with toxicity. But does anyone know of some reference values that explain the toxicity?
Nice to hear that you like it.
Some of the layers also have legend available. To view the legend for a chosen layer, click on a double down arrow at the bottom right corner in a layer element in layer selector (don’t know how to describe it better).
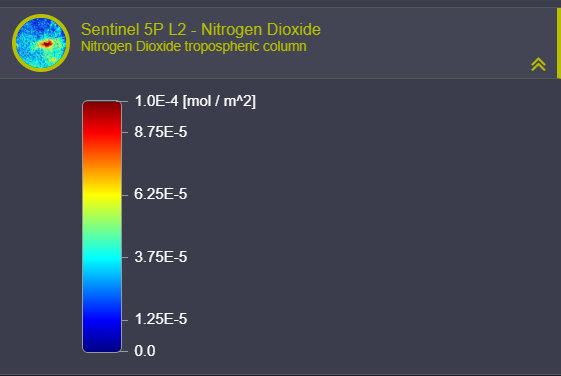
The legend for NO2 (image below) layer only shows the amount, which I don’t know if directly correlates with the toxicity.
Hope I answered the question with enough information.
Cheers.
And from what I can see it’s in the measuring units ng / m3. and the data we get from the sentinel is an area, and is therefore measured in square meters.
We know the width and length = m2, but we do not know the height = m3.
I guess it would be a stretch to just take the height from a certain sphere when we don’t know the density. For instance, say that NOx resides in both the troposphere and the stratosphere, it’s a height of 50 km. That sounds a bit excessive.