Good morning,
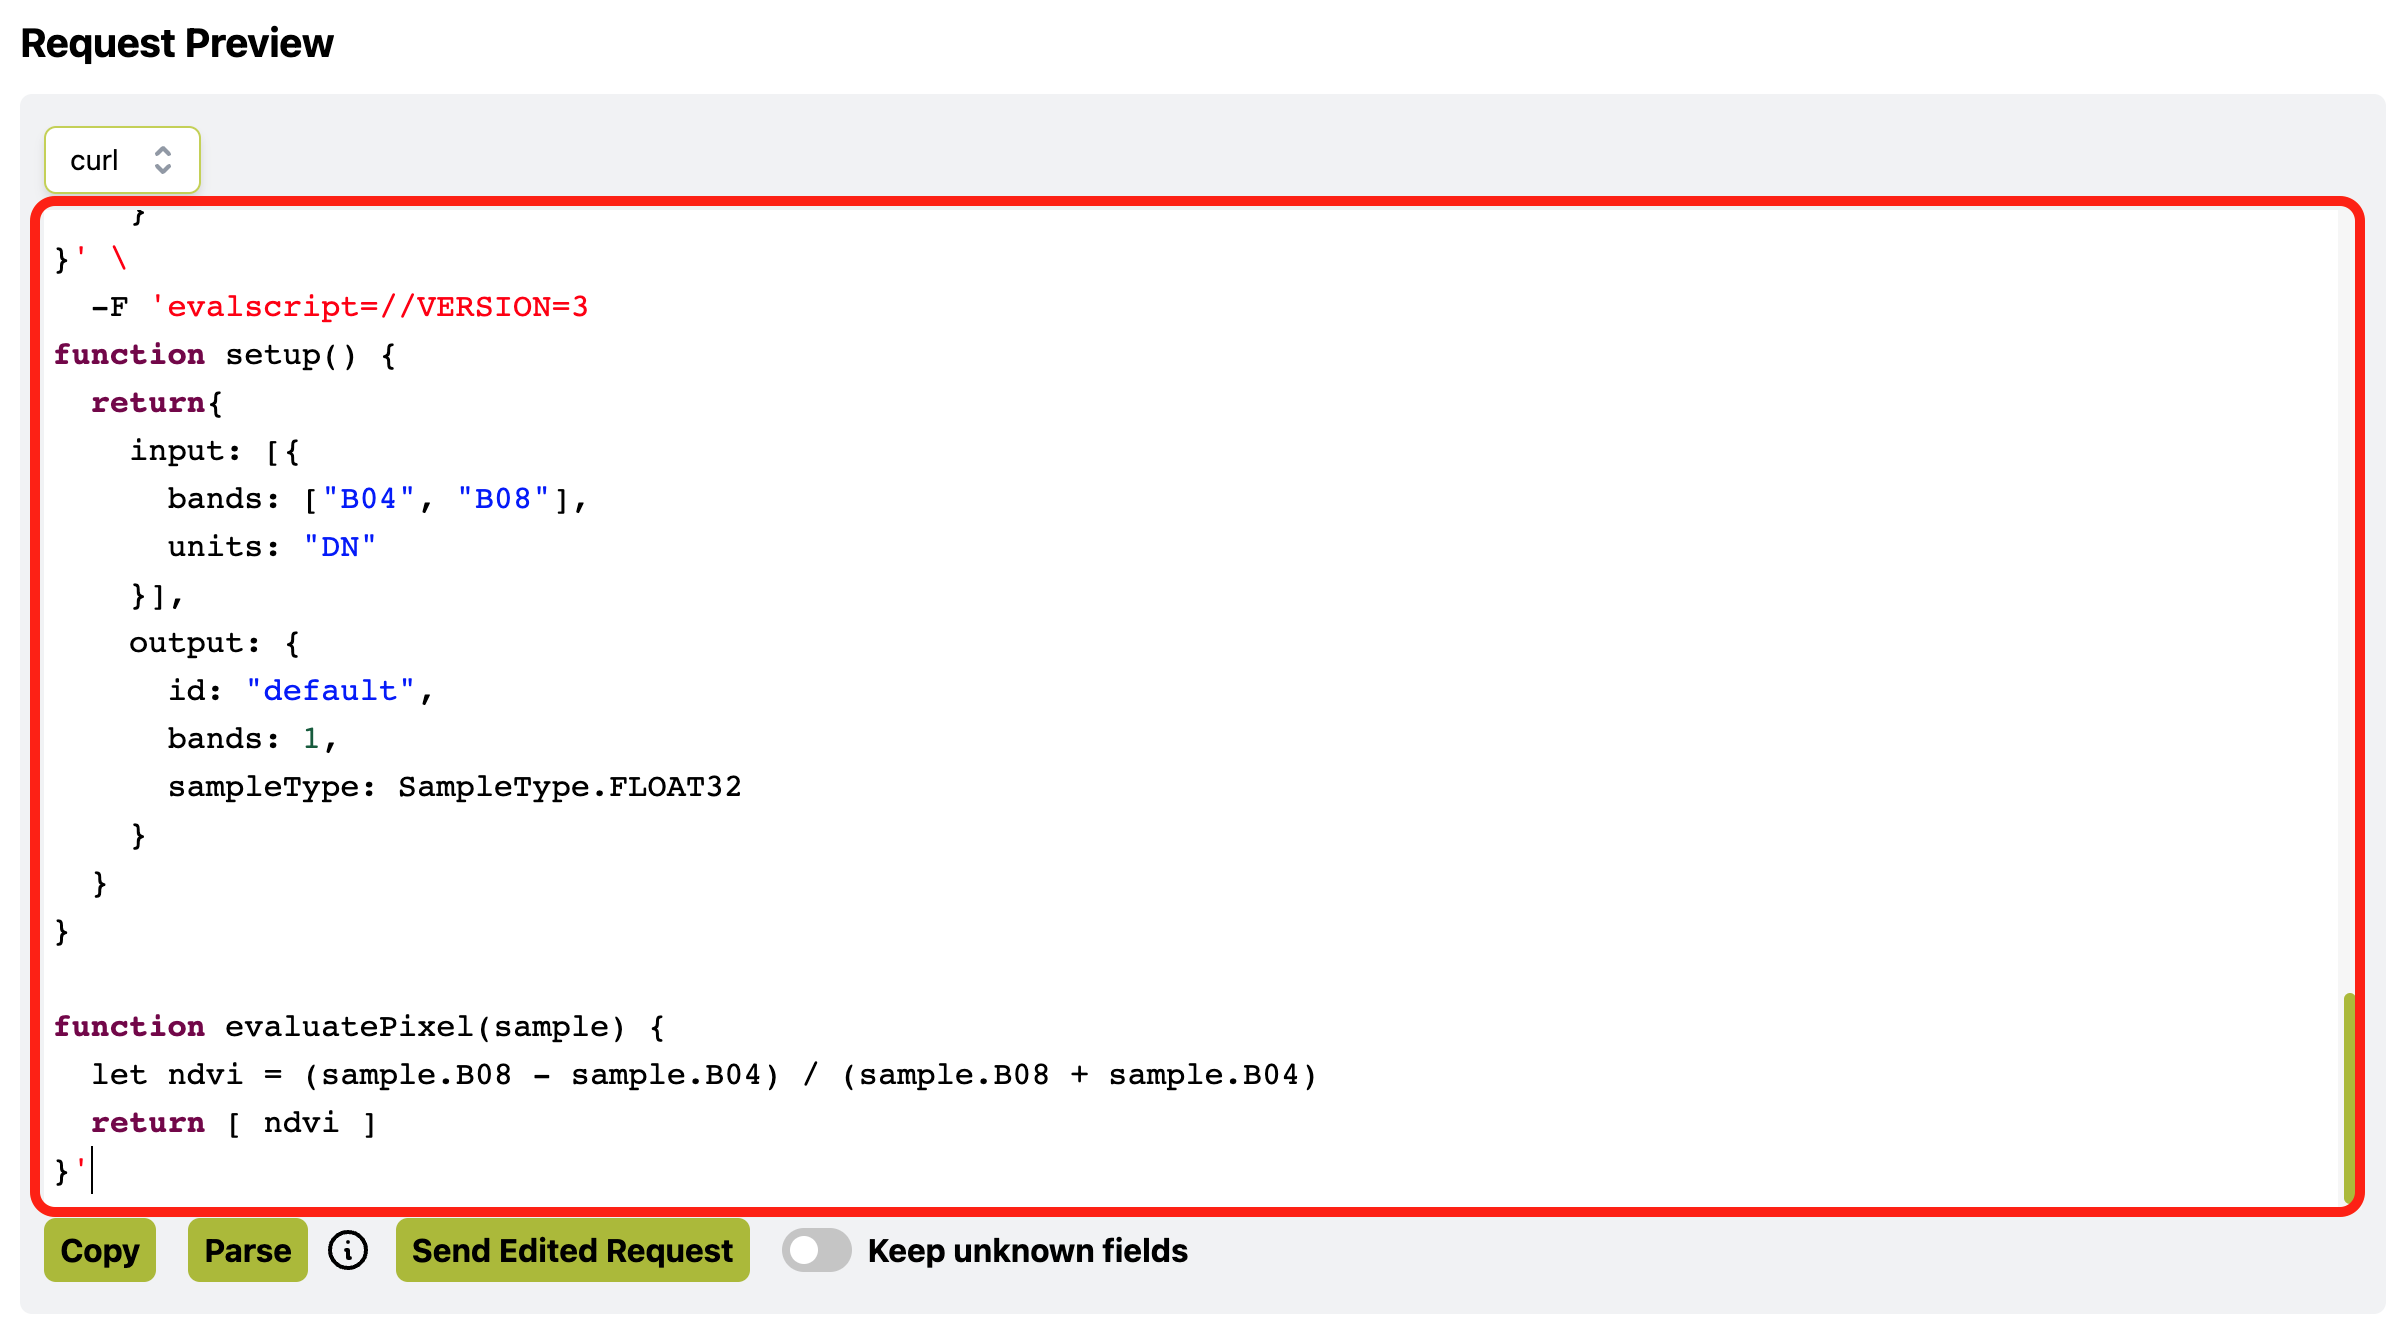
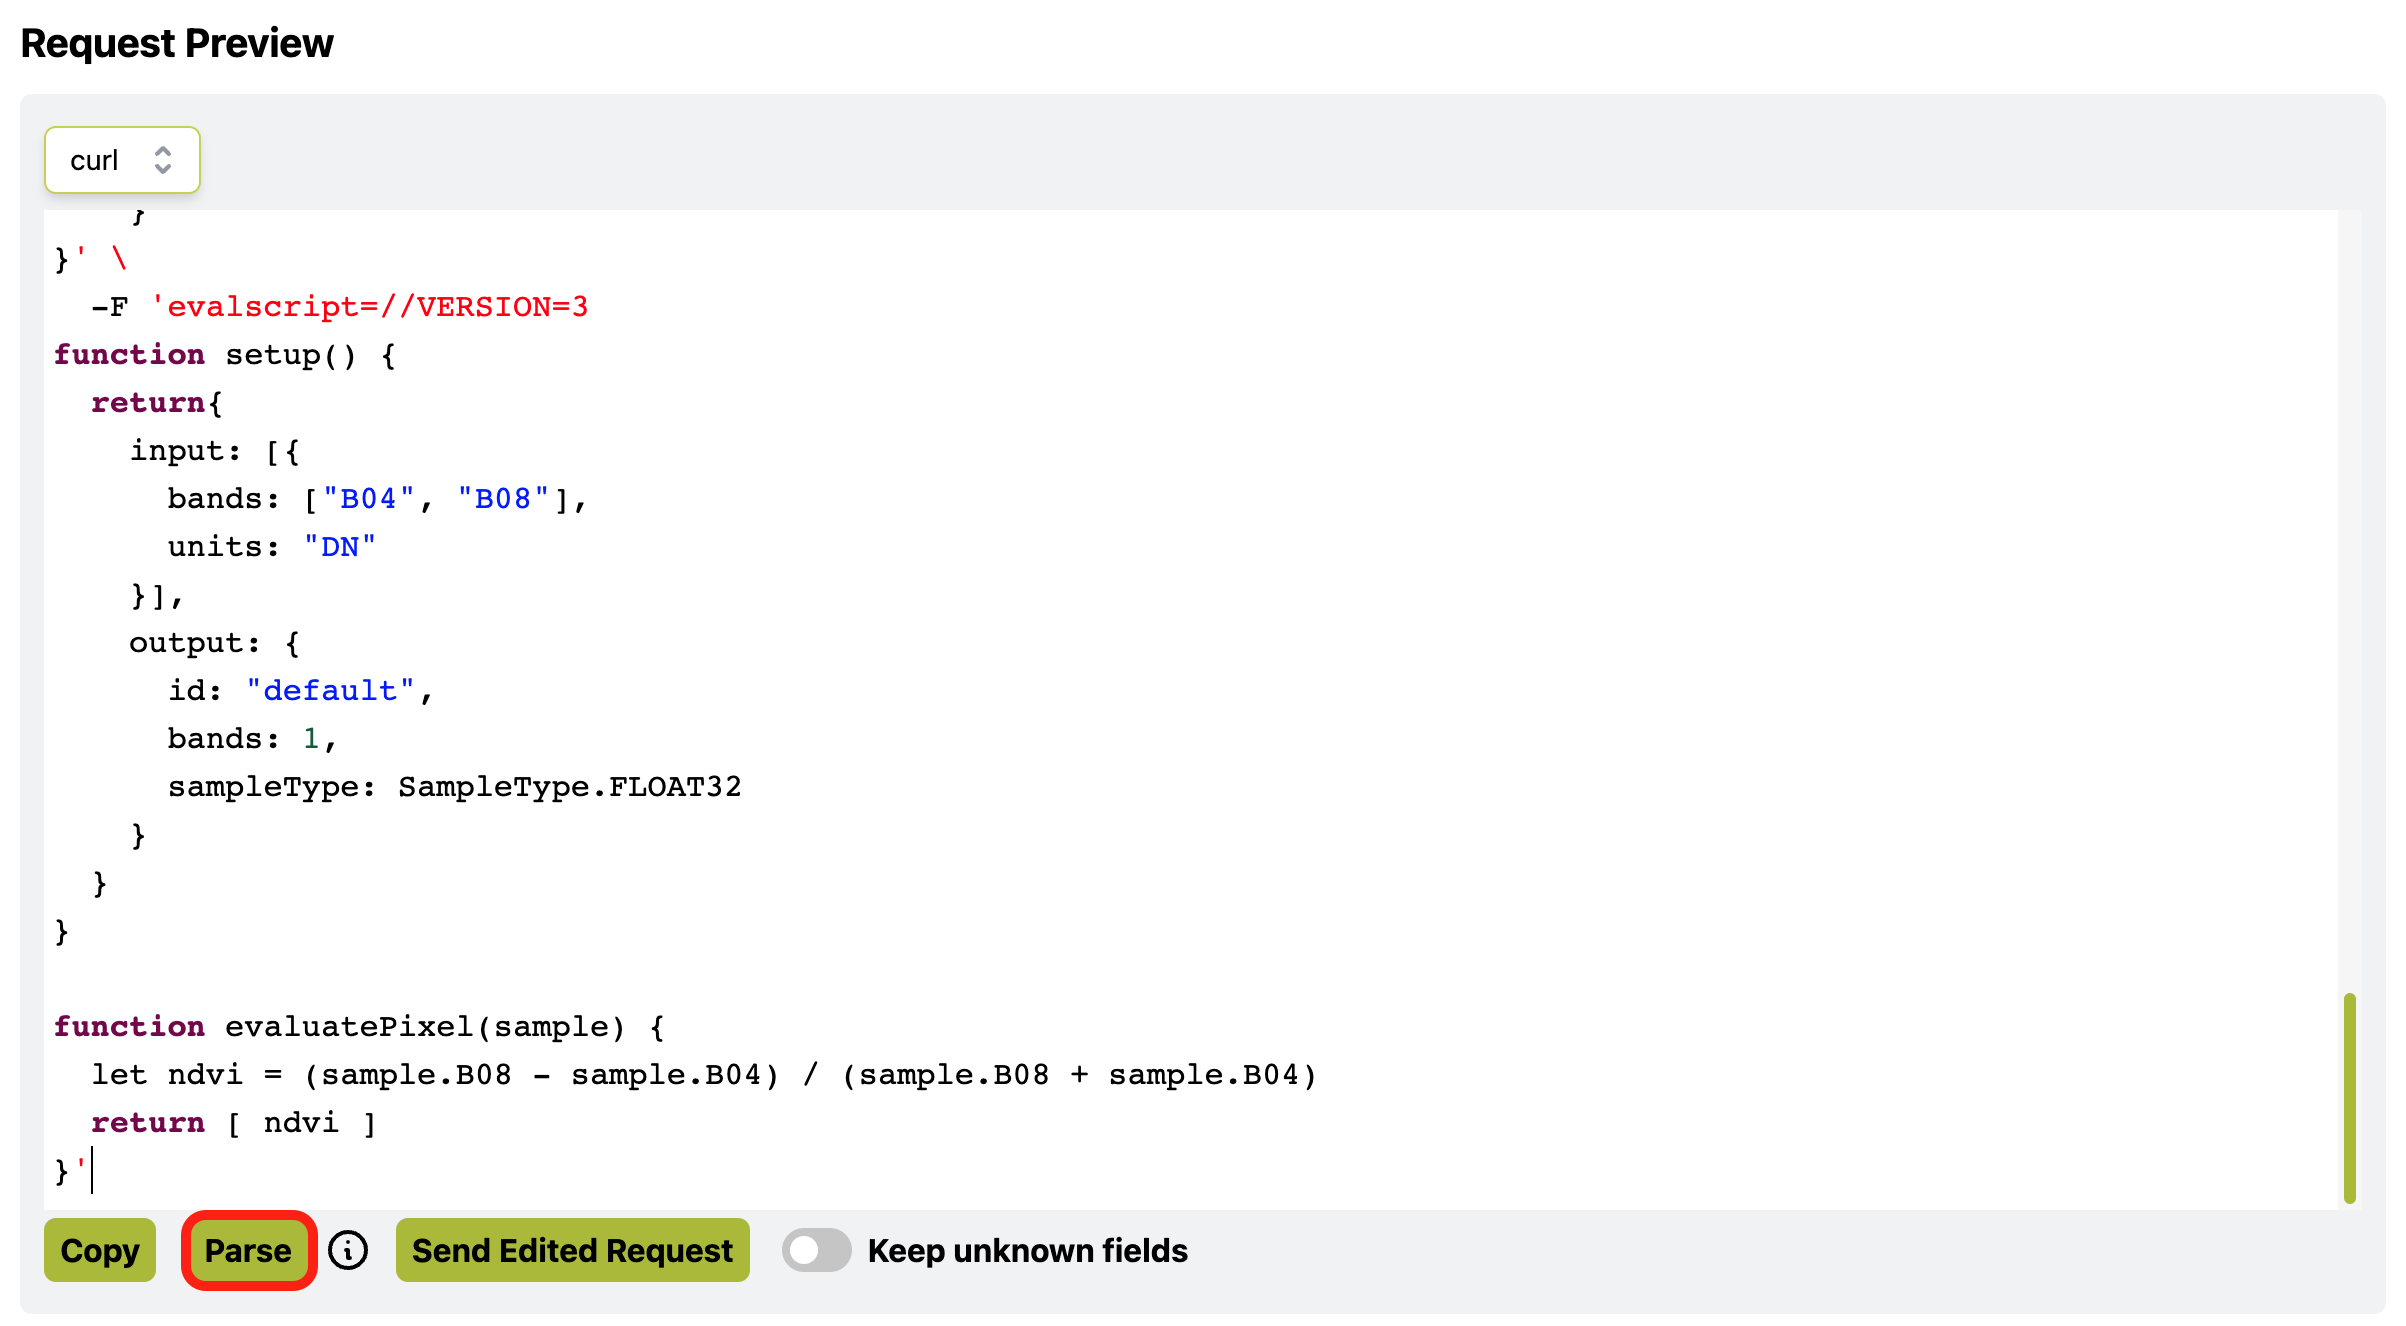
I am using index and the result of index is in image. I want it in binary form 1,-1,0.
But I don’t know how could I have it.
Thanks
def descargarImg(request):
print("----")
mylist=request.get_download_list()
count=0
for x in mylist:
count+=1
print(x.data_type)
print("-----"+str(count))
for folder, _, filenames in os.walk(request.data_folder):
    for filename in filenames:
        print(os.path.join(folder, filename))
request.save_data();
def listadoImg(nombreCarpeta):
contenido = os.listdir(’./’+nombreCarpeta)
return contenido
Credentials
config = SHConfig()
config.sh_client_id = ‘’
config.sh_client_secret = ‘’
def convertirImagen(archivoImagen,archivoDestino):
im=Image.open(archivoImagen)
im.save(archivoDestino)
“”"
parametros poligono tienen qu
“”"
def buscarImg(cord1, cord2, cord3, cord4, fechaIni, fechaFin, nombreCarpeta, tipo):
if tipo==“trueColor”:
evalscript = “”"
//VERSION=3
function setup() {
return {
input: [{“bands”: [“Blue”, “Green”, “Red”]}],
output: { bands: 3}
}
}
function evaluatePixel(sample) {
return [2.5 * sample.Red / 10000,
2.5 * sample.Green / 10000,
2.5 * sample.Blue / 10000]
}
“”"
elif tipo==“GNDVI”:
evalscript = “”"
//VERSION=3
function setup() {
return {
input: [“Green”, “NIR”, “dataMask”],
output: { bands: 4}
}
}
function evaluatePixel(sample) {
var GNDVI = index(sample.NIR , sample.Green)
return valueInterpolate(GNDVI,
[0.0, 0.3, 1.0],
[
[1, 0, 0, sample.dataMask],
[1, 1, 0, sample.dataMask],
[0.1, 0.3, 0, sample.dataMask],
])
}
“”"
elif tipo==“NVDI”:
evalscript = “”"
//VERSION=3
function setup() {
return {
input: [“Red”, “NIR”, “dataMask”],
output: { bands: 4}
}
}
function evaluatePixel(sample) {
var NDVI = index(sample.NIR , sample.Red)
return valueInterpolate(NDVI,
[0.0, 0.3, 1.0],
[
[1, 0, 0, sample.dataMask],
[1, 1, 0, sample.dataMask],
[0.1, 0.3, 0, sample.dataMask],
])
}
“”"
elif tipo==“falseColor”:
evalscript = “”"
//VERSION=3
function setup() {
return {
input: [“Green”, “Red”, “NIR”],
output: { bands: 3 }
};
}
    function evaluatePixel(sample) {
      return [sample.NIR/3000, sample.Red/3000, sample.Green/3000];
    }
    """
elif tipo=="NDWI":
    evalscript = """
    //VERSION=3
    function setup() {
      return {
        input: ["Green", "NIR"],
        output: { bands: 2 }
      };
    }

    function evaluatePixel(sample) {
        var val = (sample.Green/3000 - sample.NIR/3000) / (sample.Green/3000 + sample.NIR/3000);
        var colorB =colorBlend(val,
          [-1, -0.5, -0.2, 0, 0.2, 0.5, 1.0],
          [
            [1,0,1],
            [1,0.5, 0],
            [1,1, 0],
            [0.2,1,0.5],
            [0,0,1],
            [0,0,0.3],
            [0,0,0],
          ]);

        return colorB;
    }
    """
elif tipo=="SAVI":
    evalscript = """
    //VERSION=3
    function setup() {
      return {
        input: ["Red", "NIR"],
        output: { bands: 2 }
      };
    }

    function evaluatePixel(sample) {
        // Soil Adjusted Vegetation Index  (abbrv. SAVI)
        // General formula: (800nm - 670nm) / (800nm + 670nm + L) * (1 + L)
        // URL https://www.indexdatabase.de/db/si-single.php?sensor_id=96&rsindex_id=87
        // Initialize parameters

        let L = 0.428; // L = soil brightness correction factor could range from (0 -1)
        let index = (sample.NIR - sample.Red) / (sample.NIR + sample.Red + L) * (1.0 + L); // calculate savi index

        // using colorblend visualization  in EO browser
        return colorBlend   // Start of colorBlend function
                (index,	            //  specify the index
                [ 0,0.1, 0.2,0.4, 0.5,0.7,1], //  specify the borders
                [ [0.69,0.88,0.90],   // specify RGB colors
                 [0.74,0.72,0.42],
                 [0.60,0.80,0.20],
                 [0.13, 0.54, 0.13],
                 [0, 0.50, 0],
                 [0, 0.39, 0],
                 [0, 0.29, 0],
 ]
);
}
bbox = BBox(bbox=[-5.7585989, 37.3886755, -5.7565442, 37.3910112], crs=CRS.WGS84)
geometry = Geometry(geometry={"coordinates":[[[-5.7580946,37.3905082],[-5.7579981,37.3903292],[-5.7585989,37.3902355],[-5.7585453,37.3893489],[-5.7583629,37.3886755],[-5.7573811,37.3887778],[-5.7565442,37.3910112],[-5.7580946,37.3905082]]],"type":"Polygon"}, crs=CRS.WGS84)

request = SentinelHubRequest(
    data_folder=nombreCarpeta,
    evalscript=evalscript,
    input_data=[
    SentinelHubRequest.input_data(
        data_collection=DataCollection.define_byoc('----'),
        time_interval=('2021-09-30', '2021-10-10'),
    ),
],
    responses=[
        SentinelHubRequest.output_response('default', MimeType.JPG),
    ],
    bbox=bbox,
    geometry=geometry,
    size=[512, 512],
    config=config
)
response = request.get_data()
return request
request=buscarImg(562218, 5174019, 564201, 5172501, ‘2021-08-1’, ‘2021-08-1’,‘GNDVI’, ‘GNDVI’)
descargarImg(request)