S2 L2A resolution

Hello,

I’m using the sentinelhub python package combining catalogue and process API. The evalscript that I’m using for the NDWI is this:

//VERSION=3
    function setup() {
      return{
        input: [{
          bands: ["B03", "B08"]
        }],
        output: {
          id: "default",
          bands: 1,
          sampleType: SampleType.FLOAT32
        }
      }
    }
    function evaluatePixel(sample) {
      let ndwi = (sample.B03 - sample.B08) / (sample.B03 + sample.B08)
      return [ ndwi ]
    }

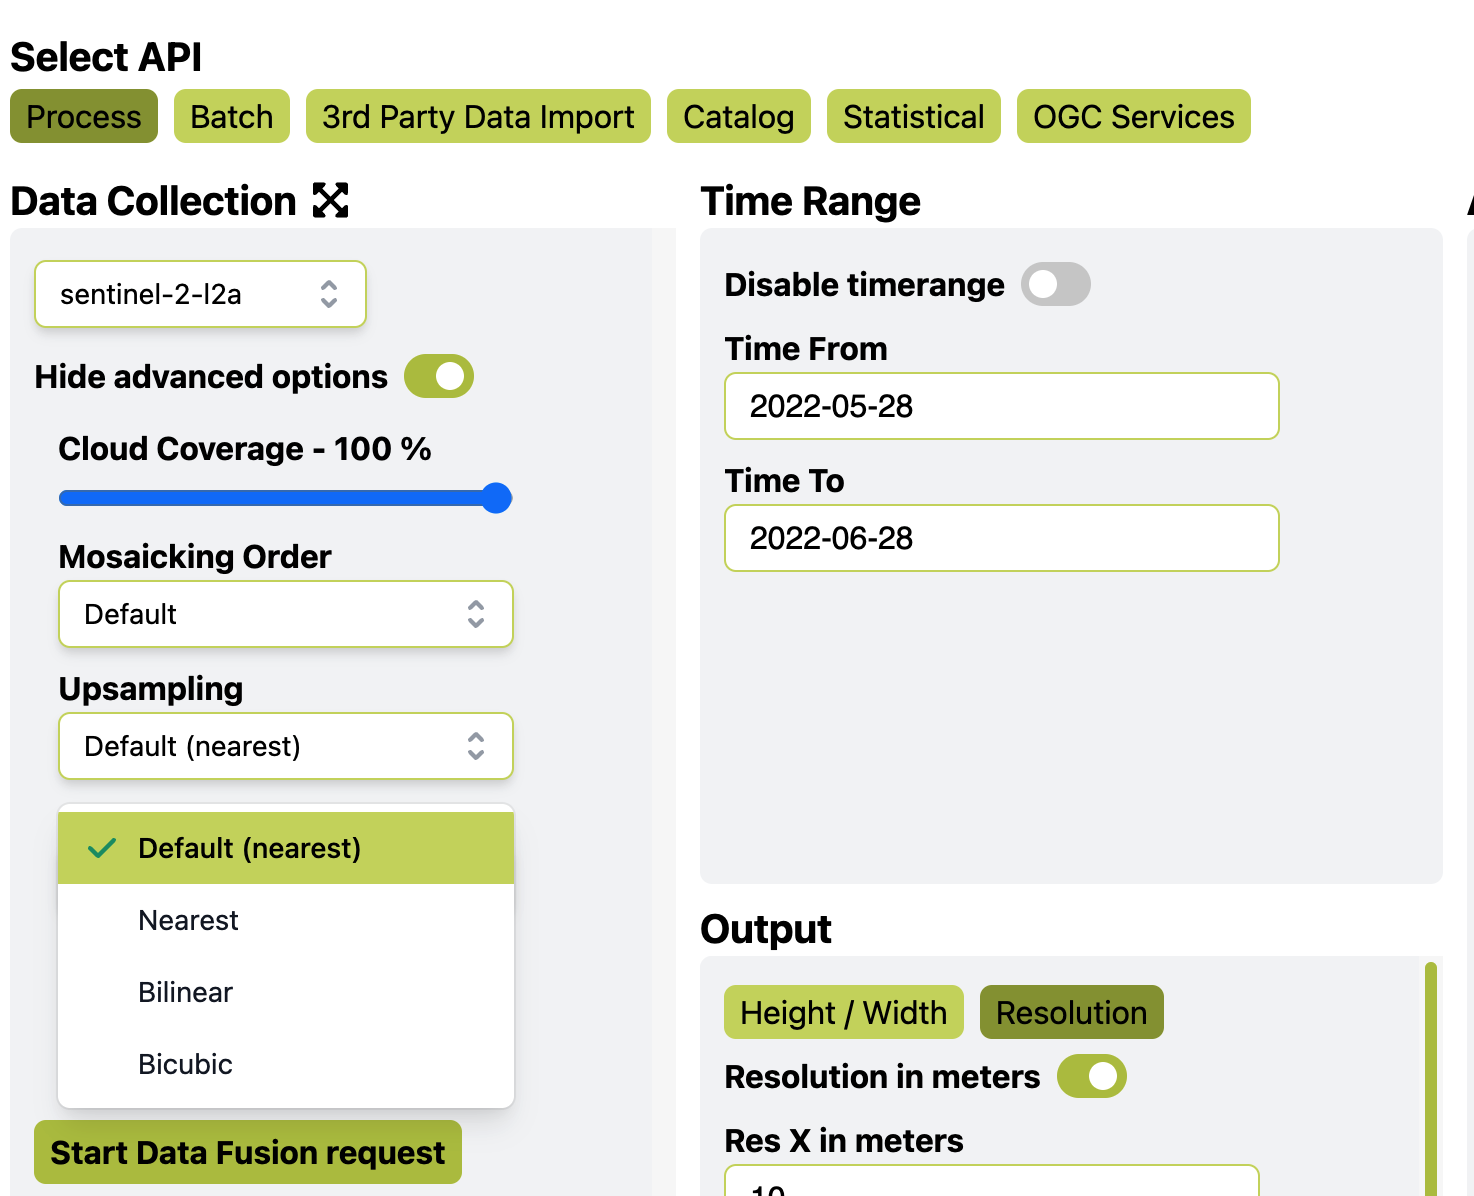
I’m programmatically downloading data from 2018 to 2022 and have noticed something strange in the results. How is it possible that a resolution of the image is different on certain parts (it is not the case that two pixels have the same value, I’ve checked)? If necessary, I can attach the python code for the process API request.


Am is missing a parameter? Do I have to specify the resolution in the process API request? When I download the same image through EO browser everything seems fine. Also, every now and then I see a “weird” pixel in the image (it is not a rectangle/square shaped).
Screenshot from 2022-06-24 11-27-34

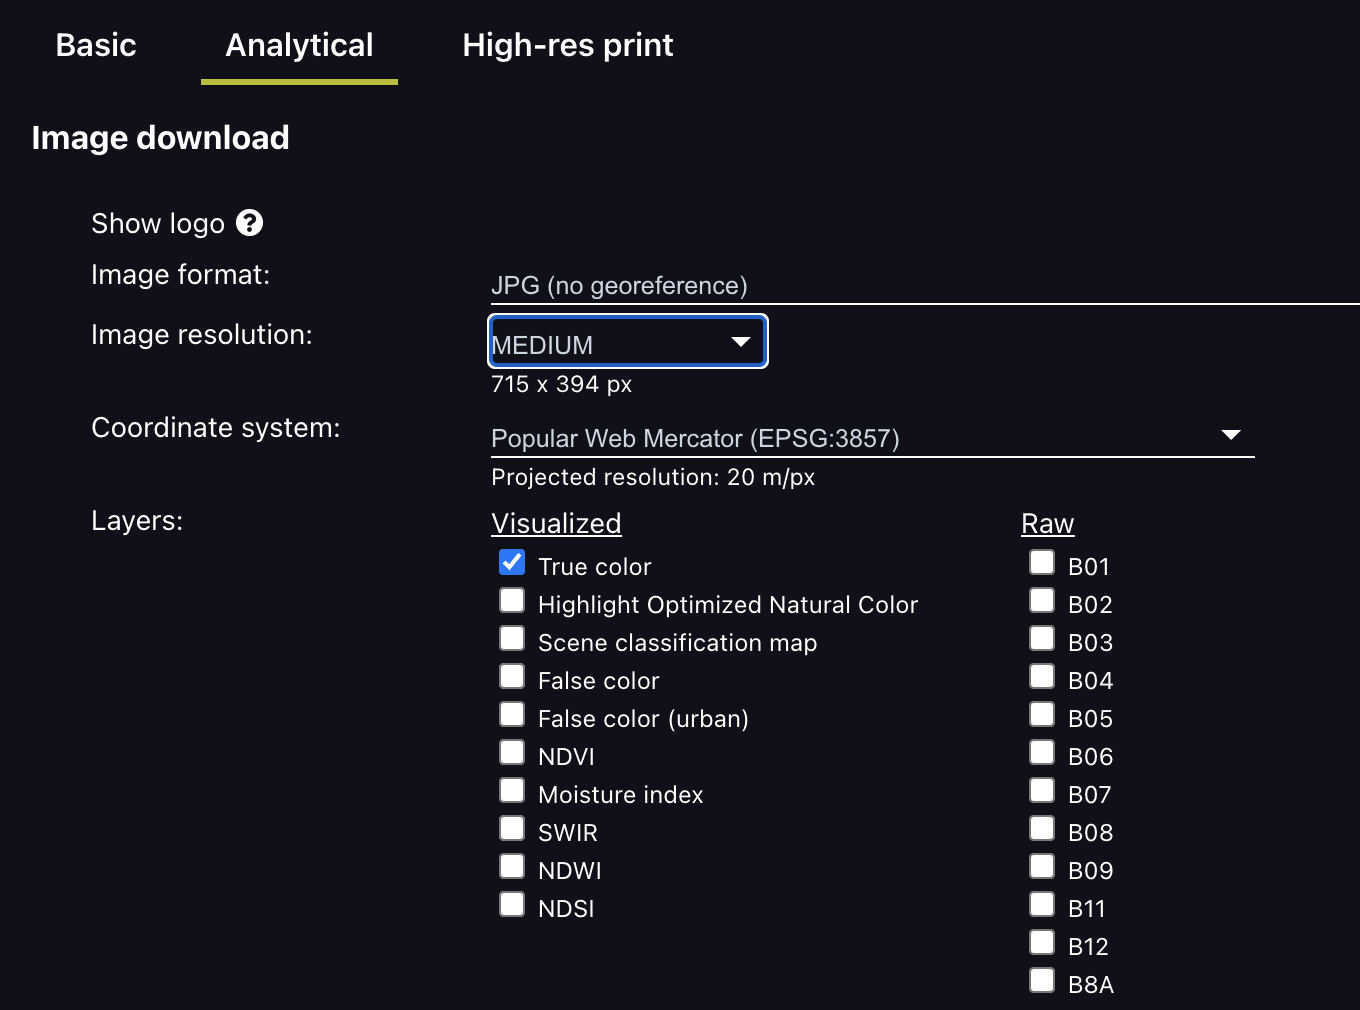
Another question, it may already be answered but I couldn’t find it - when downloading the L2A data, it is resampled to ~7x7m. How is this possible since native resolution is 10x10m? Here is tiff downloaded from EO browser.

Hi @list.labs ,

Could you please provide the code of your requests? Thank you.

Best Regards

Sure. Here it goes. If you need any additional info please let me know!

    catalog = SentinelHubCatalog(config=config)
    catalog.get_info()

    time_interval = ("2018-01-01", dt.datetime.today().strftime("%Y-%m-%d"))

    search_iterator = catalog.search(
        DataCollection.SENTINEL2_L2A,
        geometry=sentinel_geom,
        time=time_interval,
        query={"eo:cloud_cover": {"lt": 0.15}},
        fields={
            "include": [
                "id",
                "properties.datetime",
                "properties.platform",
                "properties.resolution",
                "properties.eo:cloud_cover",
                "properties.processingLevel",
            ],
            "exclude": [],
        },
    )

    results = list(search_iterator)
    time_difference = dt.timedelta(hours=1)
    all_timestamps = search_iterator.get_timestamps()
    unique_acquisitions = filter_times(all_timestamps, time_difference)
    unique_acquisitions.sort()
    process_requests = []
    timestamp: dt.datetime  # type definition

    for timestamp in unique_acquisitions:

        request_instance = SentinelHubRequest(
            evalscript=evalscript_ndwi,
            data_folder=f"{settings.ORIGINAL_IMAGERY_DIR}/s2/{area.pk}/"
            + str(timestamp).split(" ")[0],
            input_data=[
                SentinelHubRequest.input_data(
                    data_collection=DataCollection.SENTINEL2_L2A,
                    time_interval=(
                        timestamp - time_difference,
                        timestamp + time_difference,
                    ),
                )
            ],
            responses=[SentinelHubRequest.output_response("default", MimeType.TIFF)],
            geometry=sentinel_geom,
            config=config,
        )

        process_requests.append(request_instance)

    # In order to efficiently download data for all requests in parallel, we extract download information and pass it to a download client.
    client = SentinelHubDownloadClient(config=config)
    download_requests = [request.download_list[0] for request in process_requests]
    data = client.download(download_requests)

Hi @list.labs ,

I took your script and use the default bounding box of Requests Builder as the input aoi to download data from 2022-01-01 to the current date. Unfortunately, I was not able to reproduce the irregular pixels size and weird shape of pixel.

Is it possible for you to make the requests which have the following:

  • Irregular pixel size as shown in your first screenshot
  • the non-rectangle/square pixel as shown in your third screenshot

And provide the curl command of the exact requests which can be copied from Request Preview window of Requests Builder.

This would help us reproduce the issue you had and make the investigation easier. Thank you.

Best Regards

Hi @chung.horng,

here is rather a request.json for a specific date with the weird shapes.

{
    "headers": {
        "accept": "image/tiff",
        "content-type": "application/json"
    },
    "payload": {
        "evalscript": "\n//VERSION=3\n    function setup() {\n      return{\n        input: [{\n          bands: [\"B03\", \"B08\"]\n        }],\n        output: {\n          id: \"default\",\n          bands: 1,\n          sampleType: SampleType.FLOAT32\n        }\n      }\n    }\n    function evaluatePixel(sample) {\n      let ndwi = (sample.B03 - sample.B08) / (sample.B03 + sample.B08)\n      return [ ndwi ]\n    }\n\n",
        "input": {
            "bounds": {
                "geometry": {
                    "coordinates": [
                        [
                            [
                                [
                                    15.205336,
                                    44.278539
                                ],
                                [
                                    15.205336,
                                    44.282625
                                ],
                                [
                                    15.217738,
                                    44.282625
                                ],
                                [
                                    15.217738,
                                    44.278539
                                ],
                                [
                                    15.205336,
                                    44.278539
                                ]
                            ]
                        ]
                    ],
                    "type": "MultiPolygon"
                },
                "properties": {
                    "crs": "http://www.opengis.net/def/crs/EPSG/0/4326"
                }
            },
            "data": [
                {
                    "dataFilter": {
                        "timeRange": {
                            "from": "2022-03-23T08:58:23Z",
                            "to": "2022-03-23T10:58:23Z"
                        }
                    },
                    "type": "sentinel-2-l2a"
                }
            ]
        },
        "output": {
            "responses": [
                {
                    "format": {
                        "type": "image/tiff"
                    },
                    "identifier": "default"
                }
            ]
        }
    },
    "timestamp": "2022-06-24T11:15:57.933685",
    "url": "https://services.sentinel-hub.com/api/v1/process"
}

Could it be the CRS issue, I’m using EPSG:4326 since my AOI is in that CRS?

@chung.horng should i include size in the request?

geometry=sentinel_geom,
size=(10,10),

sorry, I meant resolution:

geometry=sentinel_geom,
resolution=(10,10),

Hi,

Apologies for the delayed reply: yes, you will have to specify the resolution of the data you request. Whilst the native resolution of Sentinel 2 is 10m, you can request it in any resolution you wish.

There is actually an example of requesting a specific resolution in our documentation here.

Hello @william.ray. Thank you for the answer & example. I have added the resolution parameter and everything seems fine but I now have another doubt. The evalscript I posted above is fine because I use Band 3 and Band 8 which are in 10m natively. But now I want to calculate another index:

//VERSION=3
    function setup() {
      return{
        input: [{
          bands: ["B05", "B11"]
        }],
        output: {
          id: "default",
          bands: 1,
          sampleType: SampleType.FLOAT32
        }
      }
    }
    function evaluatePixel(sample) {
      let swi = (sample.B05 - sample.B11) / (sample.B05 + sample.B11)
      return [ swi ]
    }

and I’m using the same process API request specifying the resolution (10,10). But now, I get the results in 20x20m (I have used the measure tool in QGIS). I suppose I have to include the resx and resy parameters in the evalscript? Why do I have to specify it in the SentinelHubRequest then again?

Just a side note from your example:

function evaluatePixel(sample) {
  return [2.5 * sample.B04, 2.5 * sample.B03, 2.5 * sample.B02]
}

why do you multiply the bands by 2.5 in the evaluatePixel function here?

I’ll post both request.json’s:

{
    "headers": {
        "accept": "image/tiff",
        "content-type": "application/json"
    },
    "payload": {
        "evalscript": "\n//VERSION=3\n    function setup() {\n      return{\n        input: [{\n          bands: [\"B03\", \"B08\"]\n        }],\n        output: {\n          id: \"default\",\n          bands: 1,\n          sampleType: SampleType.FLOAT32\n        }\n      }\n    }\n    function evaluatePixel(sample) {\n      let ndwi = (sample.B03 - sample.B08) / (sample.B03 + sample.B08)\n      return [ ndwi ]\n    }\n\n",
        "input": {
            "bounds": {
                "geometry": {
                    "coordinates": [
                        [
                            [
                                [
                                    603941.2915866264,
                                    4819812.390003029
                                ],
                                [
                                    603931.5425213084,
                                    4820442.877927732
                                ],
                                [
                                    605325.6039948508,
                                    4820464.579673786
                                ],
                                [
                                    605335.4838744368,
                                    4819834.091521644
                                ],
                                [
                                    603941.2915866264,
                                    4819812.390003029
                                ]
                            ]
                        ]
                    ],
                    "type": "MultiPolygon"
                },
                "properties": {
                    "crs": "http://www.opengis.net/def/crs/EPSG/0/32633"
                }
            },
            "data": [
                {
                    "dataFilter": {
                        "timeRange": {
                            "from": "2019-02-07T08:58:32Z",
                            "to": "2019-02-07T10:58:32Z"
                        }
                    },
                    "type": "sentinel-2-l2a"
                }
            ]
        },
        "output": {
            "responses": [
                {
                    "format": {
                        "type": "image/tiff"
                    },
                    "identifier": "default"
                }
            ],
            "resx": 10,
            "resy": 10
        }
    },
    "timestamp": "2022-06-27T20:31:25.727364",
    "url": "https://services.sentinel-hub.com/api/v1/process"
}
{
    "headers": {
        "accept": "image/tiff",
        "content-type": "application/json"
    },
    "payload": {
        "evalscript": "\n//VERSION=3\n    function setup() {\n      return{\n        input: [{\n          bands: [\"B05\", \"B11\"]\n        }],\n        output: {\n          id: \"default\",\n          bands: 1,\n          sampleType: SampleType.FLOAT32\n        }\n      }\n    }\n    function evaluatePixel(sample) {\n      let swi = (sample.B05 - sample.B11) / (sample.B05 + sample.B11)\n      return [ swi ]\n    }\n\n",
        "input": {
            "bounds": {
                "geometry": {
                    "coordinates": [
                        [
                            [
                                [
                                    603717.0117528609,
                                    4819737.053030815
                                ],
                                [
                                    603700.9621314881,
                                    4820777.241641103
                                ],
                                [
                                    605459.046059537,
                                    4820804.600422681
                                ],
                                [
                                    605475.367875402,
                                    4819764.411339723
                                ],
                                [
                                    603717.0117528609,
                                    4819737.053030815
                                ]
                            ]
                        ]
                    ],
                    "type": "MultiPolygon"
                },
                "properties": {
                    "crs": "http://www.opengis.net/def/crs/EPSG/0/32633"
                }
            },
            "data": [
                {
                    "dataFilter": {
                        "timeRange": {
                            "from": "2019-02-07T08:58:32Z",
                            "to": "2019-02-07T10:58:32Z"
                        }
                    },
                    "type": "sentinel-2-l2a"
                }
            ]
        },
        "output": {
            "responses": [
                {
                    "format": {
                        "type": "image/tiff"
                    },
                    "identifier": "default"
                }
            ],
            "resx": 10,
            "resy": 10
        }
    },
    "timestamp": "2022-06-28T12:47:36.939864",
    "url": "https://services.sentinel-hub.com/api/v1/process"
}

Difference is visible here:

Hi again,

It should not matter which bands you are using. If you specify 10m in your request then this should be what is returned. You do not need to specify resolution in the evalscript. As you are using the measuring tool in QGIS, is the project projection and the dataset projection the same when you are measuring?

If working correctly, Sentinel Hub APIs mean that you do not have to worry about these processing steps like resampling your bands.

And to answer you question about multiplying the bands by 2.5 in the example; this is because images can appear a little dark sometimes and for visualisation purposes you can multiply them to make the pixels a little brighter. So purely aesthetics and this shouldn’t be done if you are using the data for scientific analysis.

1 Like

Hi @william.ray. Thank you again! Ok, I’m not using the resolution parameter in the evalscript and I have done some further testing. This is my evalscript now:

//VERSION=3
    function setup() {
      return{
        input: [{
          bands: ["B02", "B03", "B04", "B05", "B08", "B11"]
        }],
        output: {
          id: "default",
          bands: 4,
          sampleType: SampleType.FLOAT32
        }
      }
    }
    function evaluatePixel(sample) {
      let ndvi = (sample.B08 - sample.B04) / (sample.B08 + sample.B04)
      let ndwi = (sample.B03 - sample.B08) / (sample.B03 + sample.B08)
      let ndbi = (sample.B11 - sample.B08) / (sample.B11 + sample.B08)
      let swi = (sample.B05 - sample.B11) / (sample.B05 + sample.B11)
      return [sample.B04, sample.B03, sample.B02, swi ]
    }

and once again RGB bands are in 10x10m resolution while SWI is in 20x20m. I’m aware that Sentinel2 doesn’t have the pan band but the data of SWI should be resampled to 10x10m. I have checked the projection in QGIS and see no mistakes there (evalscript above confirms that). Do you want me to upload the .tiff? Here is a python code once again just to be sure that I’m now making a mistake there:

request_instance = SentinelHubRequest(
            evalscript=evalscripts.evalscript_multiple_indices,
            data_folder=f"{settings.ORIGINAL_IMAGERY_DIR}/s2/{area.pk}/"
            + str(timestamp).split(" ")[0],
            input_data=[
                SentinelHubRequest.input_data(
                    data_collection=DataCollection.SENTINEL2_L2A,
                    time_interval=(
                        timestamp - time_difference,
                        timestamp + time_difference,
                    ),
                )
            ],
            responses=[SentinelHubRequest.output_response("default", MimeType.TIFF)],
            geometry=sentinel_geom,
            resolution=(10,10),
            #size = bbox_size
            config=config,
        )

OK great, now that I am visualising your result, the answer is much clearer :slight_smile:

The resolution of the fourth band (SWI) is still the same as Bands 1 to 3 (10m) but obviously appears to be 20m resolution. This is due to the sampling methods that are used by default, which is nearest neighbour. To put that in very simple terms, if you have one 20m pixel with a value of 10, if this is upsampled to 10m resolution, you end up with 4 pixels all with a value of 10. There is some more information here in our documentation. You also have a choice of Bilinear and Bicubic interpolation methods when upsampling and downsampling your data.

Hope that this helps you with your work. I’d recommend testing the different interpolation methods out and seeing how it effects your pixel values.

1 Like

And once again thank you @william.ray! Can you just point me to where can I change the interpolation method so I can give it a go? I understand that Nearest interpolation results with pixels with the same value but that then doesn’t make any sense for my calculations since I don’t have any new/added value. I might as well then use the 20x20 :slight_smile: Hope I’m making sense!

Yes, I would recommend using Request Builder to test out adding the parameter to your request.

To find the interpolation methods you can find them in the advanced options section of the Data Collection box.

1 Like

Final thank you :slight_smile: I have tried the Bilinear upsampling and everything is fine!

Hi! I have a question @william.ray
You were talking bout resolution of 10m, I have a confusion, if we specify the custom resolution in our script of 10m , will it be applied to all the 13 bands, if we are selecting, which have different resolutions of 20 and 60 m and will make them 10 m? or it will be applied on just 10m GSD bands. if we select the 20m and 60m bands, and specify the option of custom resolution of 10m, will EO browser use the information of 10m bands to upsample the 20, 60m bands? Please make it clear, I am looking for its answer for a long time. Apart from this, I also want ask another question, if we select the up-sampling options from EO browser, is it will apply on 20m, and 60m bands and will make them 10m bands? and when we select the option of down-samlping? Actually I am working on my research work, and not getting answer of all theses questions. If you make clear to me, it will be highly appreciated.

With Best Regards

hi! @list.labs I want to ask where you have declare and initialise the dt variable?

Hi,

To answer your questions:

  1. We use the following processing options when upsampling or downsampling the bands: Nearest Neighbour, Bilinear and Bicubic. We are not using information from other bands when resampling. More information about these methods can be found in the documentation.

  2. When you download the Analytical data from EO Browser, all the bands will be the same resolution and are delivered as separate GeoTIFF files in a zip folder. You can pick LOW, MEDIUM or HIGH resolution. The actual resolution will depend on your zoom level in EO Browser at the time. You can see a preview of the resolution in metres before downloading though like in the below screenshot.

I hope this answers your questions clearly.

Hello @damsreserviors. It’s just an import alias:

import datetime as dt