I recently started to work with Sentinel-3 SLSTR LST products and ran into a grid related issues.
Name of the product I’m looking at is S3A_SL_2_LST____20200813T205837_20200813T210137_20200815T023725_0180_061_314_0720_LN2_O_NT_004 You can download it from scihub.copernicus.eu if you want.
So the problem is that the pixel coordinates (in the geodetic_in.nc file, longitude_in and latitude_in variables) do not seem to be on the expected 1Km grid.
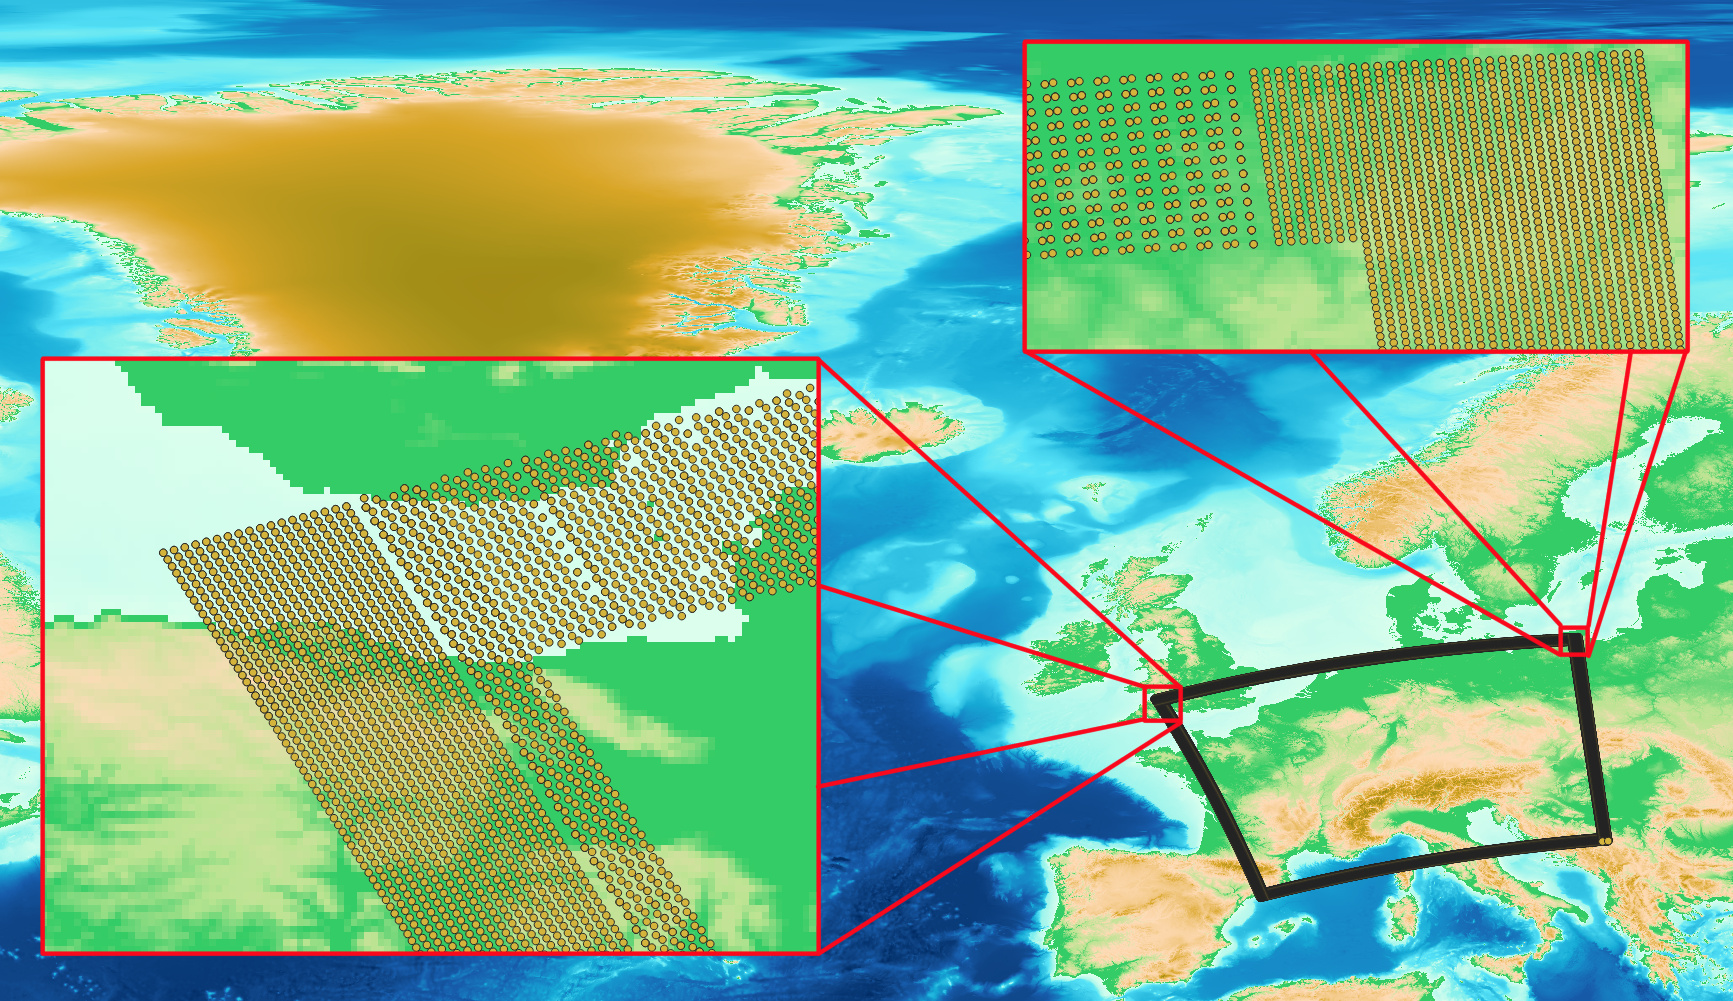
I plotted the coordinates of the first and last 25 columns and rows on a map and this is what I got:
As you can see, on the left hand side in the first 18 columns and on the right hand side in the first 32 columns the pixels are evenly distributed, but the rest of the coordinates do not follow this pattern which is surprising to me.
It is also visible that there are missing points in the inner part.
However, the most interesting is that there are quite a lot of duplicate coordinates. This is particularly confusing because I thought that’s what we have the _orphan variables for.
Is there an explanation for the 2 different pattern in the distribution, for the missing and duplicate coordinates?
This is an interesting point that you are raising. There are known issues with the geolocalisation of the pixels and the associated uncertainties in the Sentinel-3 images provided by ESA (via Copernicus Open Access Hub), but I haven’t seen any concrete information on how to deal with the issues being published by an official source.
If you want to get down to the bottom of this problem I would suggest you contact ESA or the Scihub support (eosupport@copernicus.esa.int). Please let us know if you find something interesting
Thanks for the link, it’s quite interesting. It’s good to see that I’m not the only one who ran into this issue. I think I’ll try to contact the author of that blog and ask whether he has additional info for the SLSTR grid.
Scihub support (eosupport@copernicus.esa.int)
Oh those guys already know me. I asked them recently a couple of questions, mainly technical ones regarding the Sentinel SAFE specification. They are helpful but not too fast.
If I don’t find an explanation for my issue I’ll ask them for sure.
Please let us know if you find something interesting
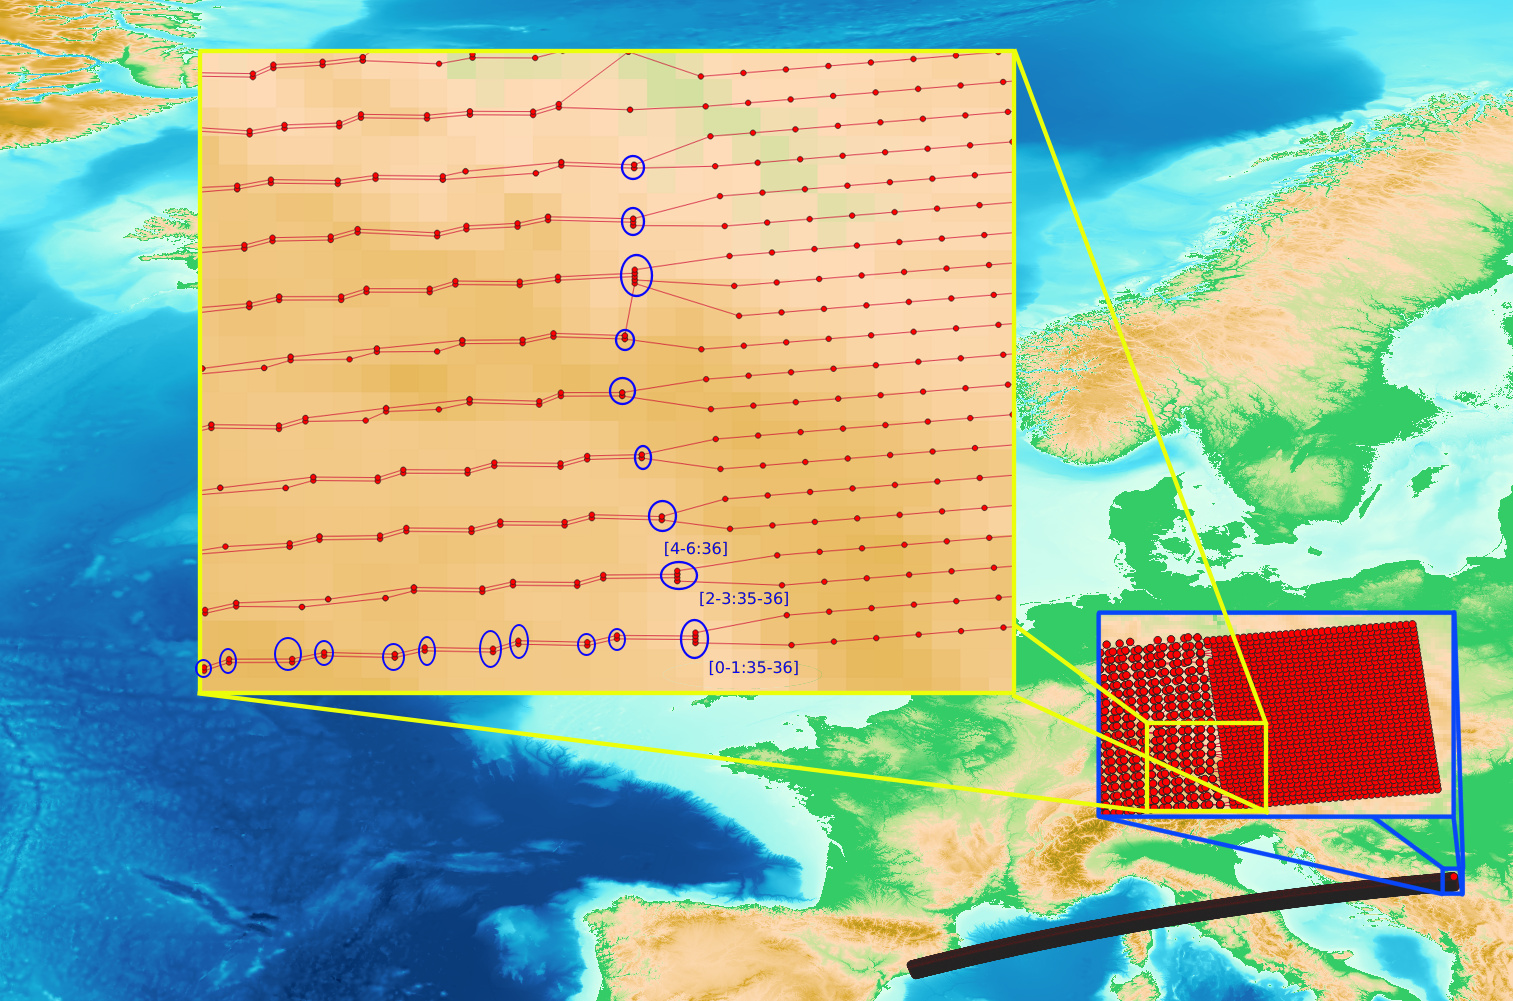
Like 80% of them is duplicate on the left hand side, I marked a couple of them with blue circle. There are cases where 4 consecutive pixel has the exact same coordinate. Strange…
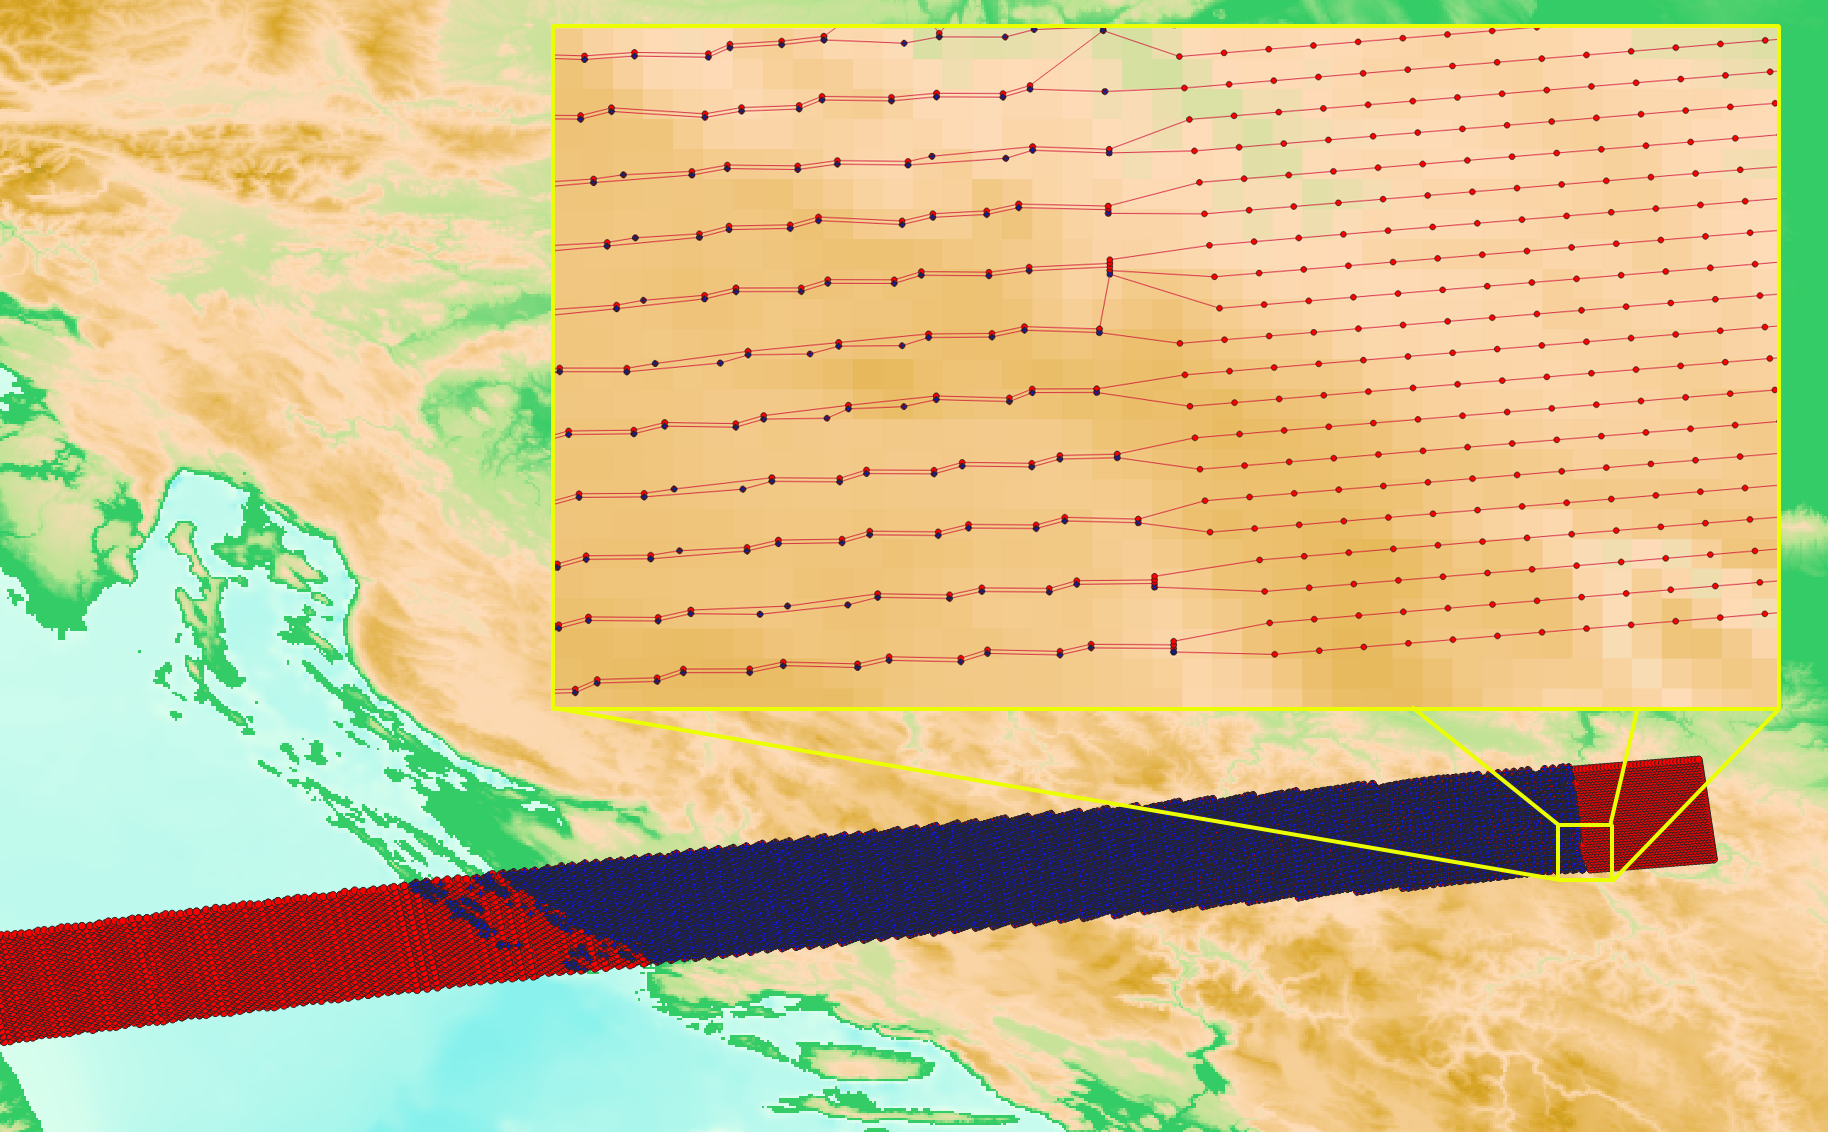
Red dots still represents the coordinates in the grid file.
Blue dots are the pixels where we have valid data in the data file.
It’s clearly visible that there is data only over land, which is fine.
That’s also visible that there is no data for the duplicate pixels, which good, because it would be confusing to have more than one value for the same coordinate.
Average distance between valid pixels is ~1048m across track and ~1918m along track.
The product description says “Gridded Land Surface Temperature generated on the wide 1 km measurement grid.” I’m not sure what a wide grid means in this context, but this is not a 1Km by 1 Km grid for sure. I’ve expected something like on the right part of the picture for the whole data product. That’s what I call a grid.