I have been trying to automate the download of False Color imagery from the sentinel-2 L2A archive. I’ve been able to locate several image products **(examples., NVDI, BOA., etc) using “sen2r” (Luigi Ranghettia., et al.,), however, I am having trouble locating the False Color images. Are these specific images stored in a unique archive that you can point me to?
Alternatively, if you have any scripts, guidance, or other methods that I can use as a reference to automate the download of False Color images from sentinel-2 L2A, that would be greatly appreciated.
Hi Bekalu, welcome to the forum, don’t worry there is nothing mysterious about False Color images, it merely refers to the combination of bands that are visualised in the image. When visualising data, we are limited to what the human eye can see (visible light) and digital images are made up of pixels with varying RGB values. A True Color image is just that; the Red channel is represented by Red pixels and so on.
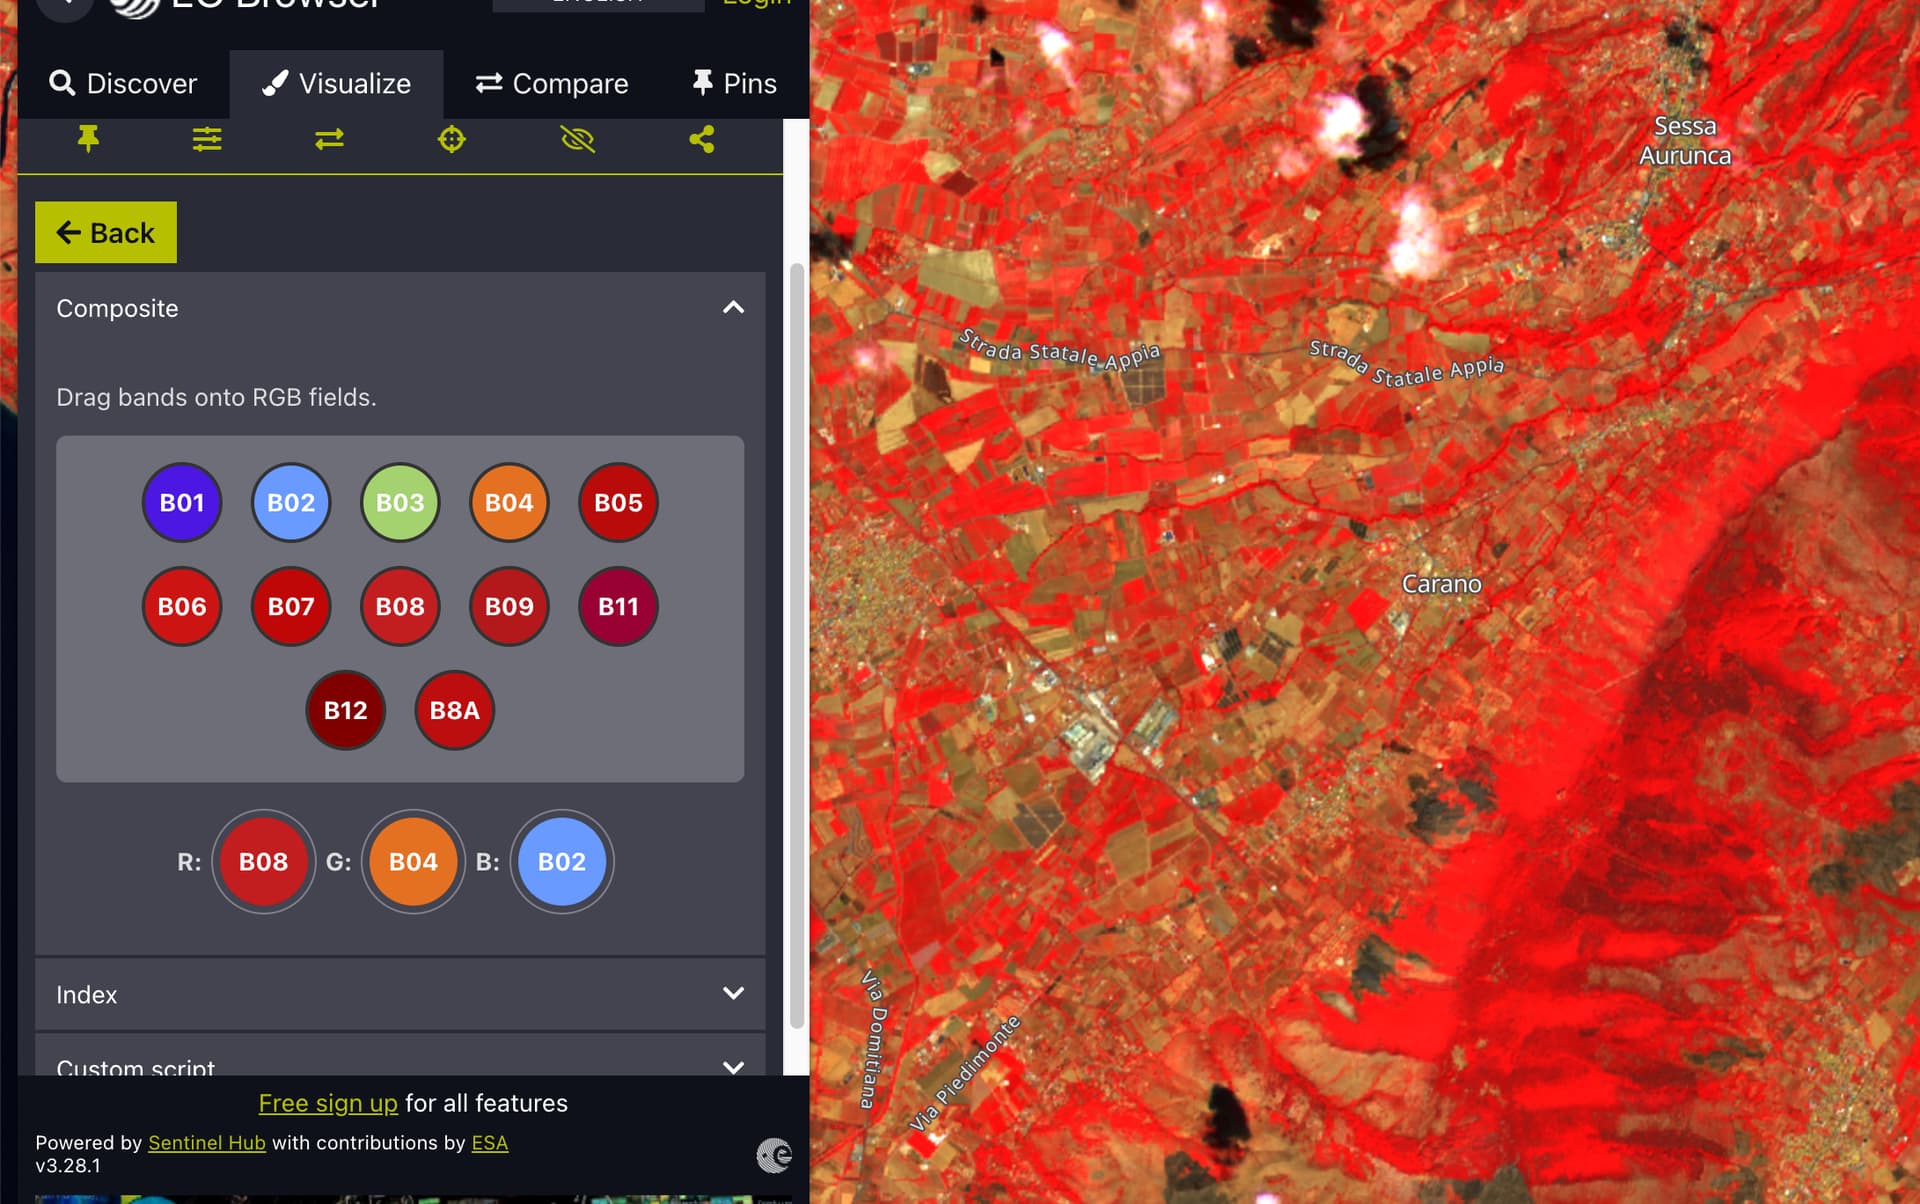
However, Sentinel-2 collects data outside the visible spectrum so when we visualise data outside the visible spectrum, these are referred to as False Color images. The most common use of this is when the NIR band is represented by Red, the Red band by Green and Green by Blue. You can see what this looks like here in the EO Browser application.
I would also recommend clicking the edit button beside the False Color legend entry and then experiment with the different band combinations too.
To find out how to request this type of visualisation automatically, we have a script that you can use in our custom scripts repository too.
You can then insert this evalscript into a curl request (we also have a dedicated python package too but I think you are using R?), adapting one of the examples in our documentation.
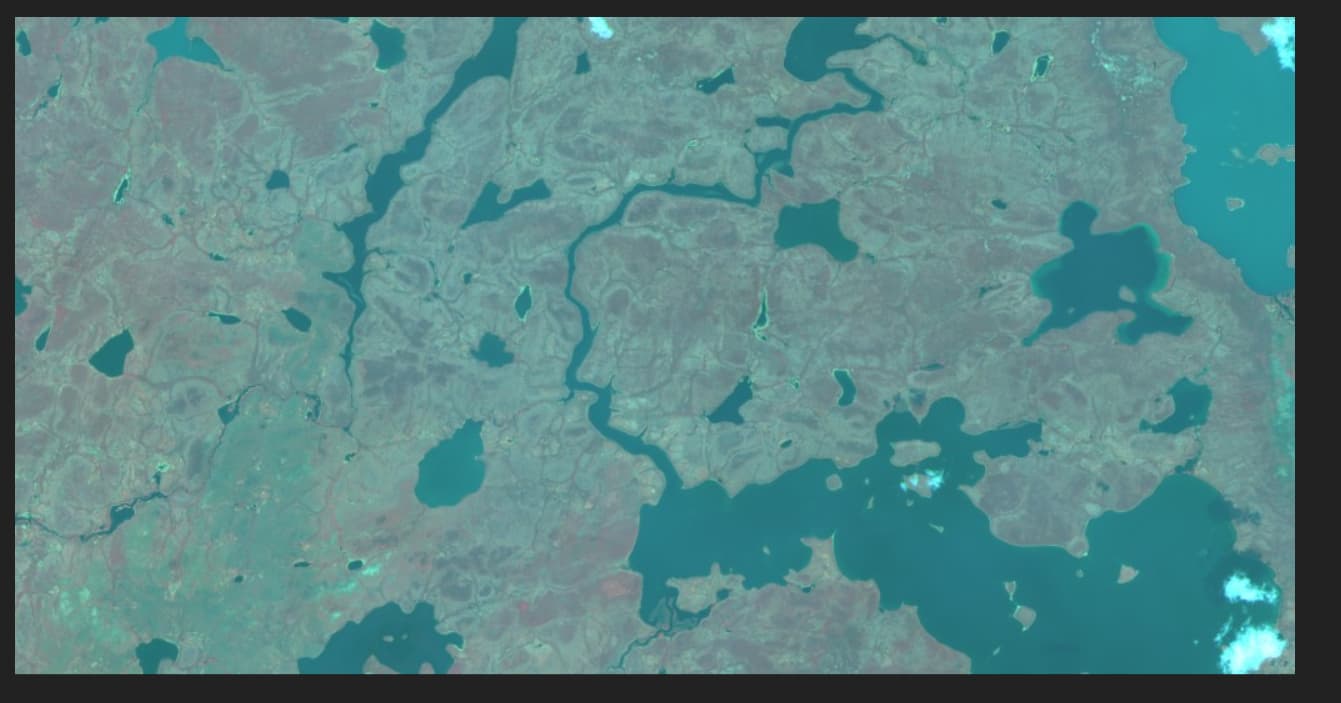
Comparing the two images, it looks like they are from different dates which is probably one cause of why they look different. Have you got a link to the where you obtained the image?
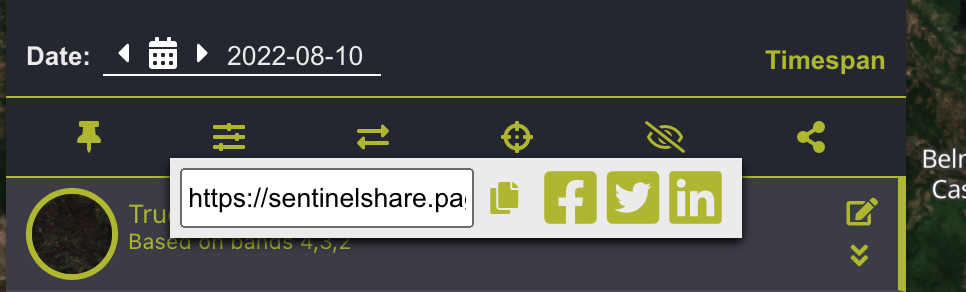
If you click the Share button below the Time Range button you can share the exact location and visualisation with me
Hi, the two images in your previous post are definitely different dates so that is probably the cause of why they look different. Especially, in the regions you are looking at, land cover is not static and looks very different at different times of the year.
There are also different band combinations that you can try, there are some predefined ones we provide but as I showed you earlier, you can create your own combinations.