Sentinel-1 GRD IW resolution (pixel spacing)

I would like to get a Sentinel-1 GRD IW image with a resolution (pixel spacing) of 10 m.
I followed the documentation here https://docs.sentinel-hub.com/api/latest/data/sentinel-1-grd/#resolution-pixel-spacing and added the following arguments:

"resolution":"HIGH",
					"acquisitionMode":"IW",
					"polarization":"DV"
					
                },
                "processing": {
                    "orthorectify": "true",
                    "backCoeff": "SIGMA0_ELLIPSOID",
					"demInstance":"COPERNICUS_30"

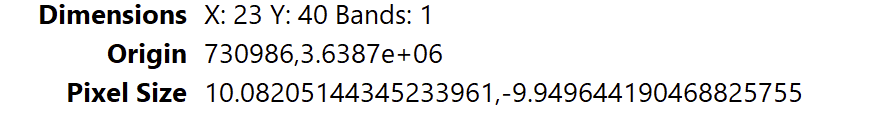
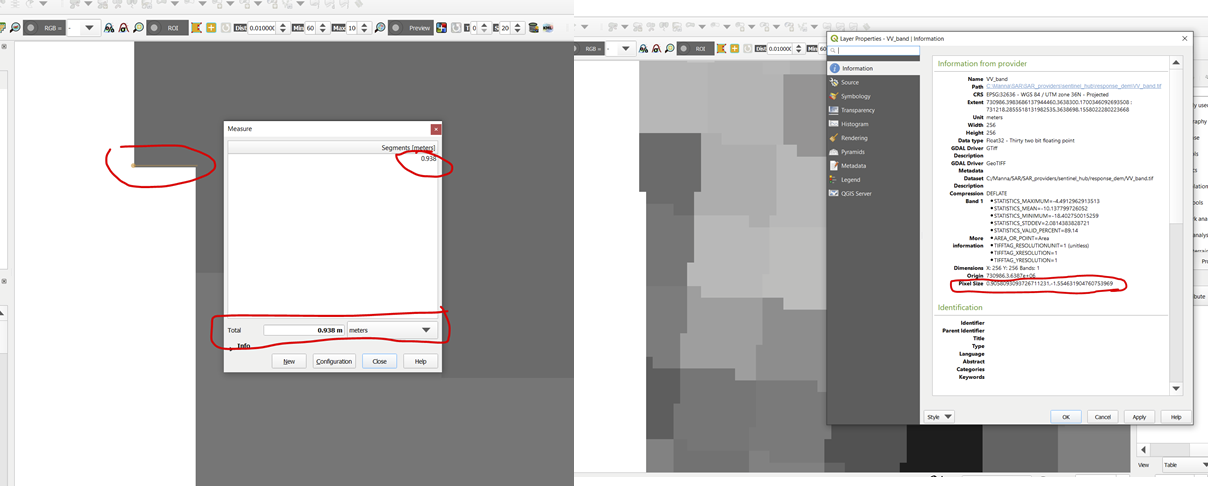
But the image that I get have weird-looking pixels:

This is the full Postman request:

curl -X POST \
  https://services.sentinel-hub.com/api/v1/process \
  -H 'Authorization: Bearer <your access token>' \
  -H 'Accept: application/tar' \
  -F 'request={
    "input": {
        "bounds": {
            
           "properties": {
                "crs": "http://www.opengis.net/def/crs/EPSG/0/32636"
            },
			      "geometry": {
        "type": "Polygon",
        "coordinates": [
            [
			[
			   731218.285551813198254,
			   3638664.083626470062882
			],
			[
			   731194.312673397595063,
			   3638679.522067714948207
			],
			[
			   731116.488903416553512,
			   3638656.200575838796794
			],
			[
			   731033.023514467058703,
			   3638680.746944668702781
			],
			[
			   730986.398368613794446,
			   3638698.155802228022367
			],
			[
			   730992.083120428957045,
			   3638304.788882832042873
			],
			[
			   731200.68230208940804,
			   3638300.170034609269351
			],
			[
			   731218.285551813198254,
			   3638664.083626470062882
			]
 
            ]
          ]
		}
        },
        "data": [
            {
                "type": "sentinel-1-grd",
                "dataFilter": {
                    "timeRange": {
                        "from": "2021-12-01T00:00:00Z",
                        "to": "2022-01-12T23:59:59Z"
                    },
					"resolution":"HIGH",
					"acquisitionMode":"IW",
					"polarization":"DV"
					
                },
                "processing": {
                    "orthorectify": "true",
                    "backCoeff": "SIGMA0_ELLIPSOID",
					"demInstance":"COPERNICUS_30"
                }
            }
        ]
    },
    "output": {
 
        "responses": [
            {
                "identifier": "VV_band",
                "format": {
                    "type": "image/tiff"
                }
            }
        ]
    }
}' \
  -F 'evalscript=//VERSION=3
function setup() {
  return {
    input: ["VV"],
    output: [{ id:"VV_band", bands: 1, sampleType: "FLOAT32"},
             ]
  }
}
function evaluatePixel(samples) {
  return [10 * Math.log(samples.VV) / Math.LN10]
}'

Hi @ranpelta ,

Thank you for providing us with your full request to reproduce your findings. You can set the resolution in the output section of your request payload like this:

  "output": {
    "resx": 10,
    "resy": 10,
    "responses": [
      {
        "identifier": "VV_band",
        "format": {
          "type": "image/tiff"
        }
      }
    ]
  }

Please note that the parameters resx and resy will be provided in CRS units, which in your case (EPSG:32636) are meters anyway. But if you were to specify these parameters for a request using WGS84 as CRS, these would be in degrees.

@max.kampen - thanks, I did that, though it is not exactly 10 m .

Do you know why is that?

I found the perfect explanation for this in an older forum post.

… an output image covers the geographical extent requested by bbox (if geometry is requested we calcualte its bbox) and the size of an output image (i.e number of pixels in x and y) is calculated based on the requested resolution, e.g. width of bbox / resx and is rounded to the closest whole number.
As a consequence, you will get the output image with exactly the requested resolution only when the width and height of the requested bbox are multiples of the requested resolutions.

Please check this request example using a bbox that results in exactly 10m resolution:

curl -X POST https://services.sentinel-hub.com/api/v1/process 
 -H 'Content-Type: application/json' 
 -H 'Authorization: Bearer <your access token>' 
 -d '{
  "input": {
    "bounds": {
      "bbox": [
        730990,
        3638300,
        731220,
        3638700
      ],
      "properties": {
        "crs": "http://www.opengis.net/def/crs/EPSG/0/32636"
      }
    },
    "data": [
      {
        "dataFilter": {
          "timeRange": {
            "from": "2021-12-01T00:00:00Z",
            "to": "2022-01-12T23:59:59Z"
          },
          "resolution": "HIGH",
          "acquisitionMode": "IW",
          "polarization": "DV"
        },
        "processing": {
          "orthorectify": "true",
          "backCoeff": "SIGMA0_ELLIPSOID",
          "demInstance": "COPERNICUS_30"
        },
        "type": "sentinel-1-grd"
      }
    ]
  },
  "output": {
    "resx": 10,
    "resy": 10,
    "responses": [
      {
        "identifier": "VV_band",
        "format": {
          "type": "image/tiff"
        }
      }
    ]
  },
  "evalscript": "//VERSION=3\nfunction setup() {\n  return {\n    input: [\"VV\"],\n    output: [{ id:\"VV_band\", bands: 1, sampleType: \"FLOAT32\"},\n             ]\n  }\n}\nfunction evaluatePixel(samples) {\n  return [10 * Math.log(samples.VV) / Math.LN10]\n}"
}'

I hope that clears things up :slight_smile:

1 Like

I understand, thanks