A few months ago, I asked about some specifics about Sentinel-1 orbits (here). Among those questions, we were wondering if data should be separated by orbit or not, as the bibliography said that orbit in non-plane topography impacts data.
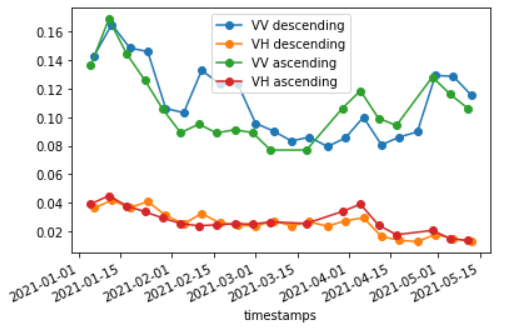
We observed that in several cases of ours, for example as below:
We can see that ascending and descending VV/VH are sometimes quite different, particularly VV (for example around half of february). There is another example in the topic I linked earlier.
A descending and an ascending pattern can be seen in both bands, i.e. VV and VH. For instance, descending data has one spike in late january and in mi-february, but is lower than ascending variables starting around may. So at least it seems logical from this pov.
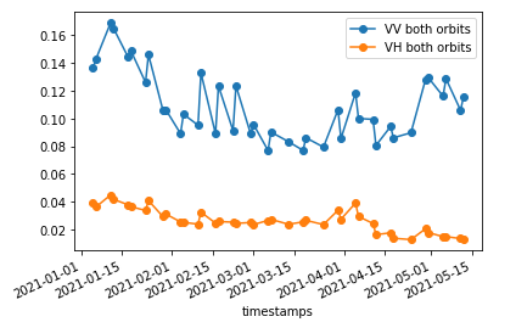
When we call for both orbits without separating them, we obtain the following graphics:
You can see that the signal with both orbits seems unstable and rather spiky as expected (for example around mid-february, once again).
We got the data using sentinelhub package in Python. The data is from the data collection SENTINEL1_IW, GRD_data (VV and VH) and GAMMA0_terrain using the DEM from Copernicus for terrain flattening. A Lee filter is applied in the SentinelHubInputTask. Our ROI is in Morroco, thus we have both orbits with a revisit time of maximum 6 days. It seems that our ROI is rather flat, but is occupied with crops (agricultural land).
Our interrogations are about how to either use or filter the data so it can be usable:
I understand that the orbit (i.e., how the satellite “arrives” in the ROI -either North to South or South to North) impacts the signal due to the topography and what is present on the ground. How much does the terrain correction help with that?
In my last topic, it was advised to use each orbit separately. I understand where this comes from, but to use 2 VV and 2 VH for modelling other variables is unfortunately not very usable. Does anyone have an insight on what could be done ? We understand that averaging is not optimal (and maybe even incorrect?). We thought of making a filtering (with a butter filter for instance) when the difference between ascending and descending is too high, but ultimately it’s all the same problem as averaging. We have two different values and neither are wrong since they’re observations. Does anyone have experience about using only one VV or VH variable with both orbits?
We tried to look up this topic on the forum and elsewhere but could not find any answers, unfortunately.
Thank you for reading me!
Léa
Nice to see people like you digging into the details of Sentinel-1 processing. It’s also great that you have shared your finding on the forum. I’ll try to give some thoughts on the points you raise to the best of my knowledge…
When looking at data from two different orbit directions, the signal is not only modified by the topography but also by different scattering processes of the surface under consideration due to varying acquisition angles. If we were to make an analogy with optical remote sensing, it would be a bit like BRDF effects. The terrain correction will help to some extent in correcting the “macro” effects from the topography. However, I don’t believe it is enough: you will still have the angular scattering effects in play - meaning that the data isn’t directly comparable. Your graphs made me think of a blog article that was posted by VITO in 2019, I think you will find it interesting.
It was recommended to separate the orbits in your last forum post: this was based on our research team’s literature review (e.g. Garioud et al. 2020) and some workshops on the matter. Your analysis performed and values plotted also show this. The common practice is to consider different orbits as separate data sources in the machine learning pipeline, then fuse the features after the calculation. Then again, it’s hard to answer you because combining orbits or not will heavily depend on your use-case. Lastly, can you expand on why “to use 2 VV and 2 VH for modelling other variables is unfortunately not very usable”? That’s the approach taken in many cases.
Hi @maxim.lamare !
Here we meet once more! Thanks for taking the time to answer.
I understand better the effect of angles on the output thanks to your point #1.
As for #2, indeed, separated VV/VH between ascending and descending is not a problem for machine learning applications. While we use these techniques, it’s not always the case. For instance, we could calculate indexes off of VV and VH values, such as the degree of polarization, which is linked to the “fullness” of a canopy. It can be approached as VV/(VV + VH) and can be used on our end to help with agronomic studies, but here we would have a difference of ~10% in mid-February between descending and ascending, making it harder to interpret and use (as humans at least ahaha).
However, we understand that it’s better to keep them unmerged and to use ascending and descending data on their own due to the scattering effects you mentionned, which are actually also usable and valuable data. It seem unusual to try to merge them so I guess we just haven’t figure things out enough yet