Hi, I am trying to download Sentinel5P data but I noticed the values for layers AER_AI_354_388 and AER_AI_340_380 are outside the normal range specified here. It is reported that the minimum value for these layers is -1 but I often encounter values lower than this threshold. I am downloading the data using Python SDK in this way
the same for AER_AI_340_380 . I very rarely noticed some negative values also for HCHO layer which uses the exact same script.
Am I doing something wrong ?
Thanks in advance for the help
Your script looks fine to me. As mentioned in the documentation, the Typical Range indicates what values are common for a given band and unit, however outliers can be expected.
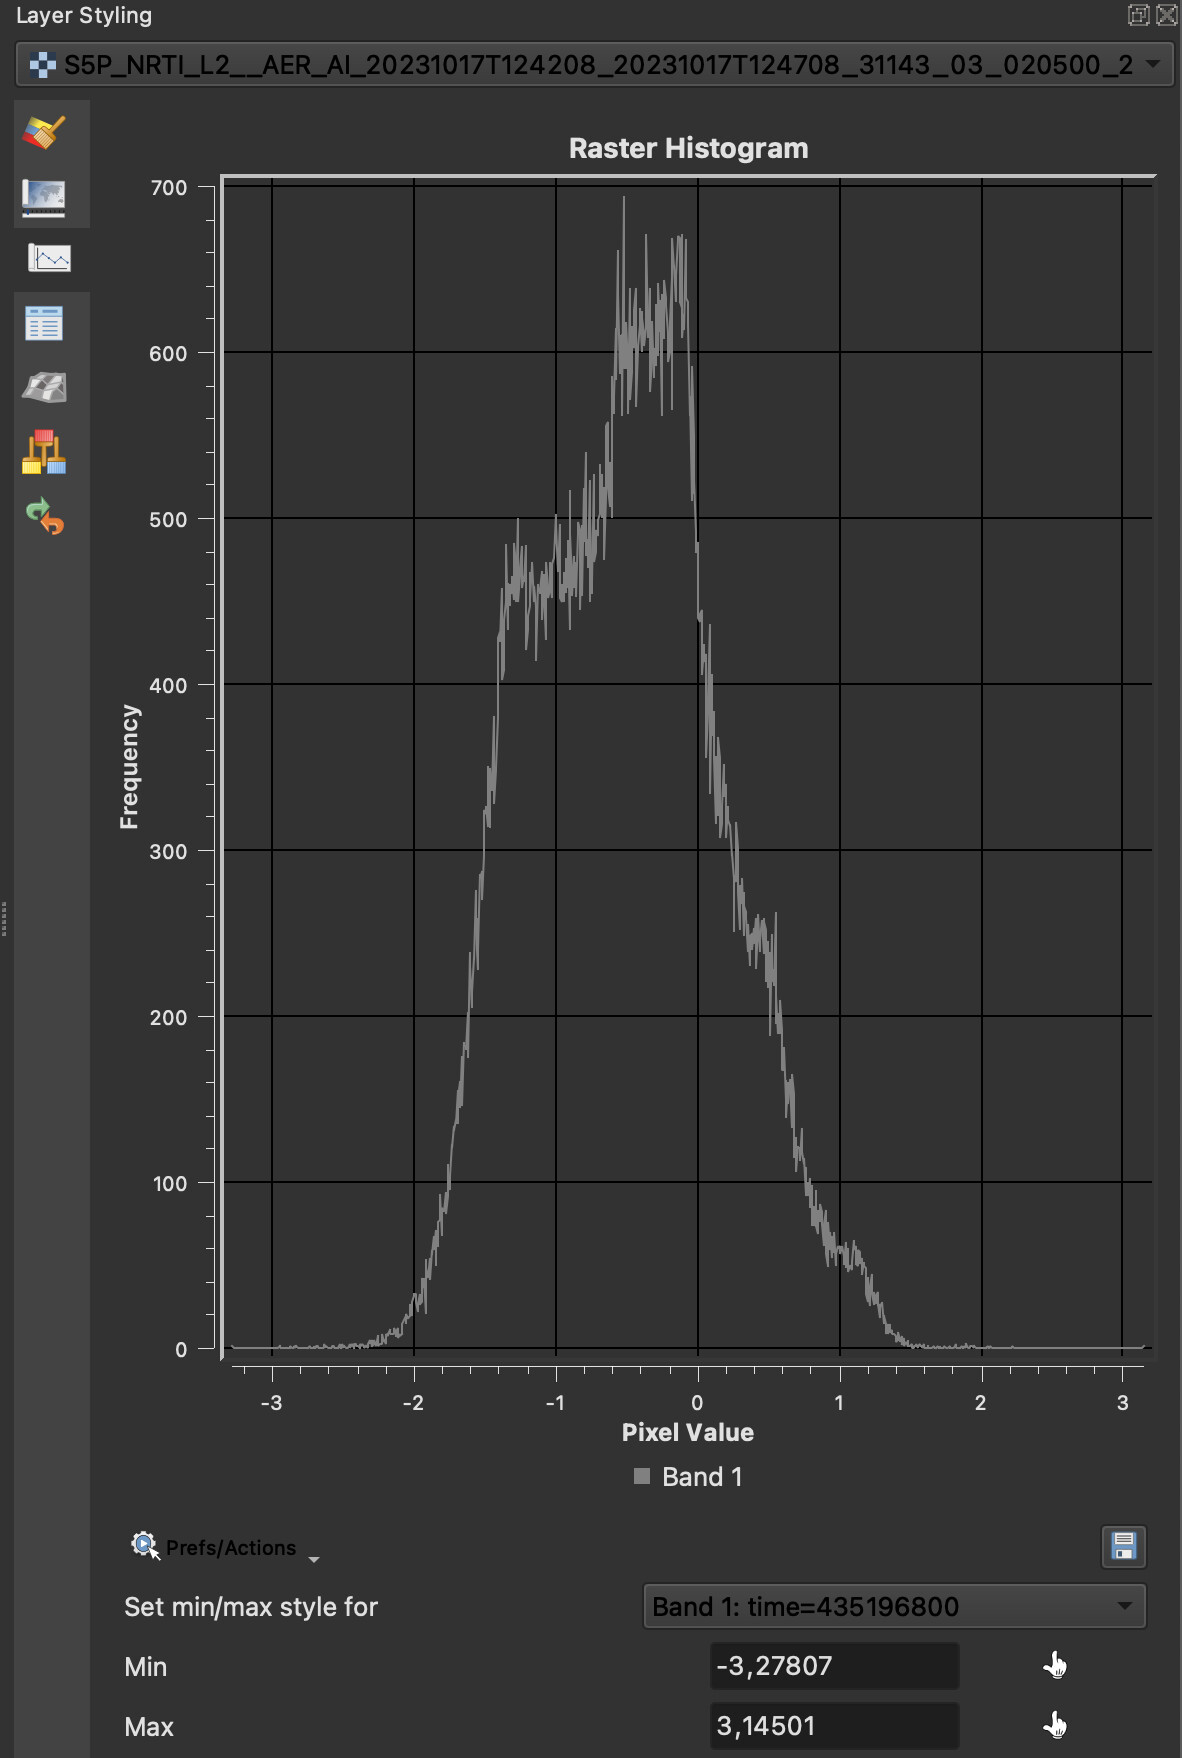
I randomly downloaded an original file from Copernicus and the histogram did indicate that there’re values lower than -1 (Fig 1).
Hi @chung.horng, thanks for your reply.
I understand that Typical Range indicates common values but negative values do not make so much sense to me since they should be concentration values in mol/m^2. I would then consider those values as wrong acquisition and discard them, what do you think?
In addition, I noticed that the tile downloaded with my script and the values reported in EO Browser are different. More in detail, considering the metropolitan area of Milan on 2018-04-30 for some regions my downloaded tile has values lower than -1 while EO Browser shows values around 0.5 in the same area.
For this reason, I am still forced to think there is something wrong with downloaded data, or the alternative could be that the EO browser does some post-processing before visualisation. What do you think about this?
Hi @chung.horng,
my AOI is ( 9.0408867, 45.3867381, 9.2781103, 45.5358482 ).
Regarding AER_AI_340_380 and AER_AI_354_388 layers the timestamp in which I observed the discrepancy between my tile and EO Browser is 2018-04-30T10-27-52.
For what concerns HCHO layers I have to check the timestamp in which I obtained negative values but I can easily discard them as negative concentrations are for sure due to a noisy acquisition.