Hello there,
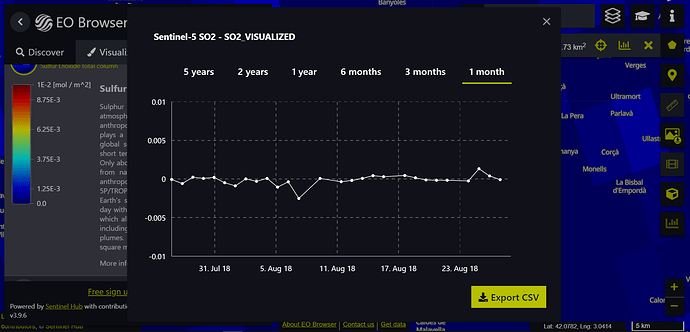
I am doing a research project for high school. I was annalizing Sulphur Dioxide data and I have a question. Does anyone know why are some minimum levels in negative? I ask this because I have realized that in the legend there are only positive numbers. Thank you.
Hi @cramon,
Could you please provide a link or an example request where you are getting negative values? Are you using EO Browser or an API?
By the way, it’s great that you are using Sentinel Hub for your project!
Hey @maxim.lamare ,
I am using EO Browser. I cannot provide you a link because the negative values I get are in the Excel I download. I insert this picture as an example of negative values.
It is an interesting tool to use for a project and I have enjoyed it.
I found the area and time-range you are looking at in the screenshot and investigated a little bit.
Sentinel-5 P, as all instruments, does not measure perfectly and has some uncertainties coming from the detector (for example noise). On top of that, you have errors coming from the algorithms used to calculate SO2 from the raw measurements (for example trace gas absorption cross-sections or clouds…). There is an entire section on errors in the S5P technical document (if you are brave  ).
).
As you have pointed out, you sometimes see negative values in the data: these come from noise in the data, which can arise over clean regions or for very low SO2 emissions.
