Sentinel1 images shifted with respect to one another

Hi,

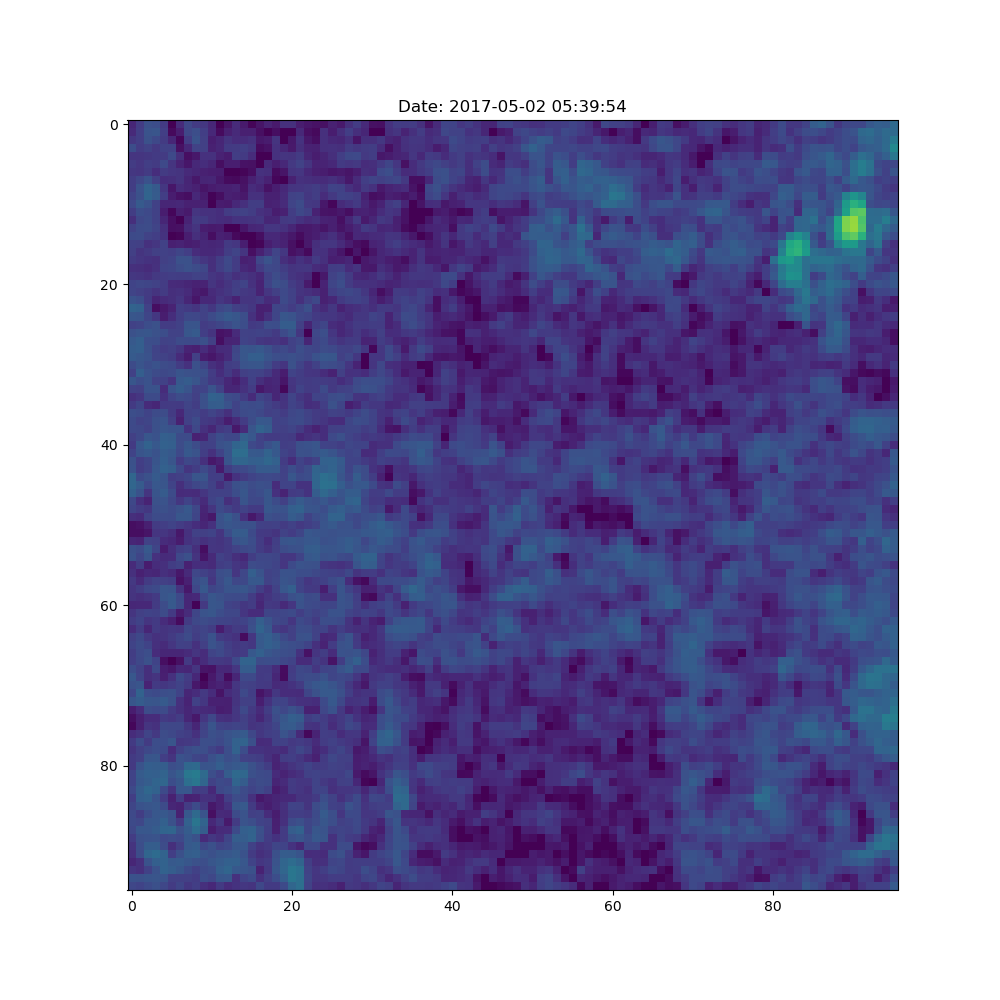
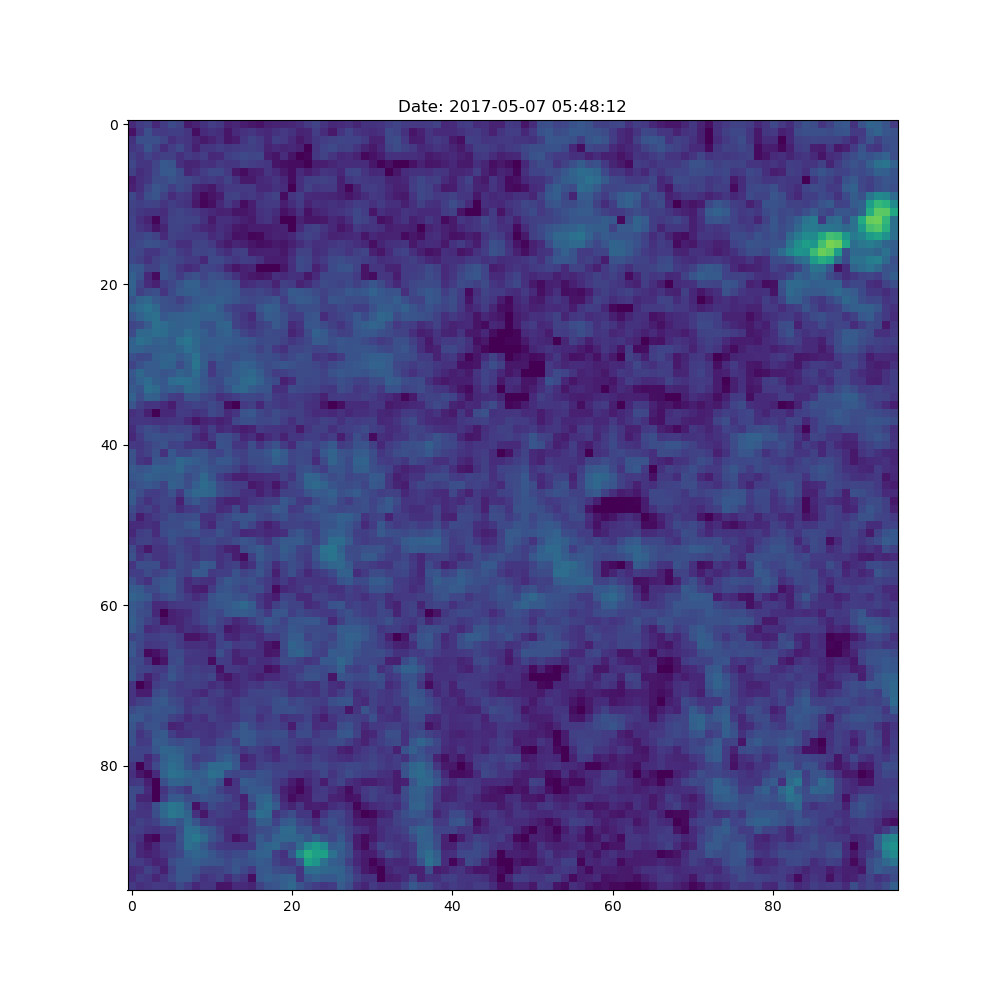
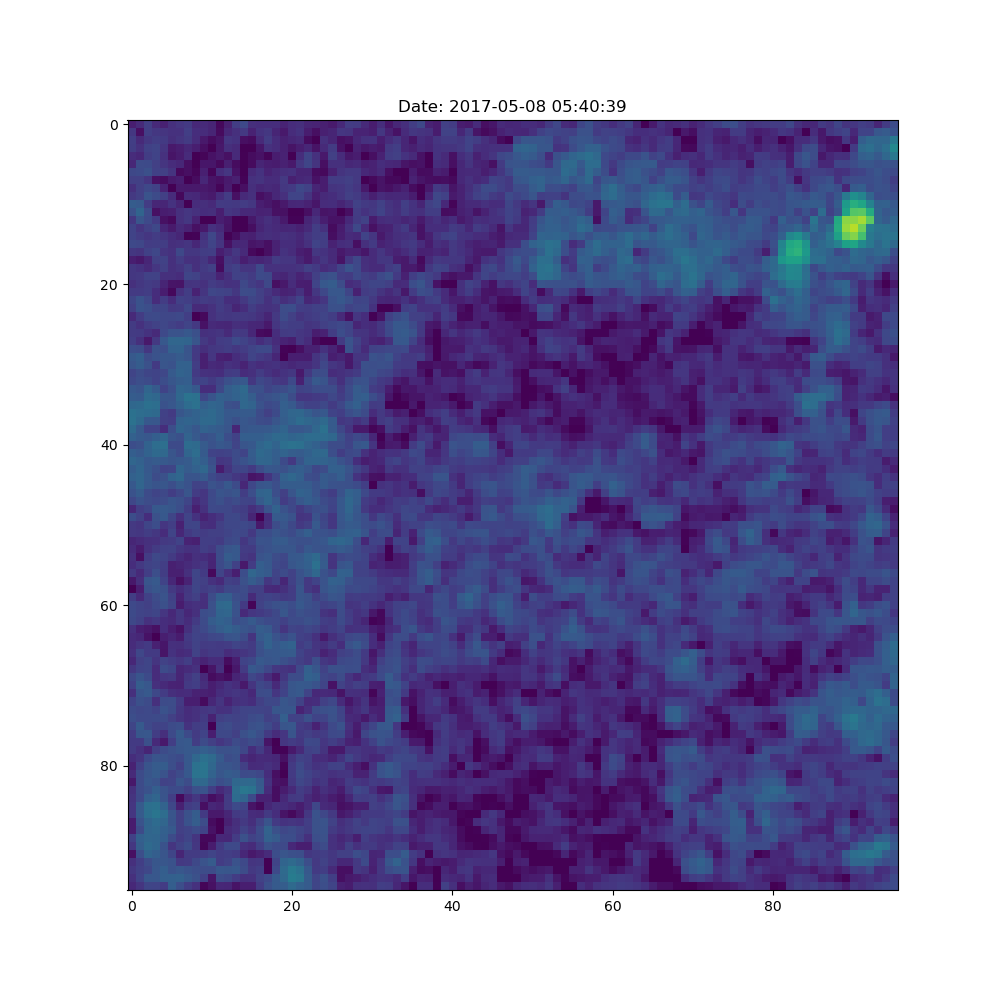
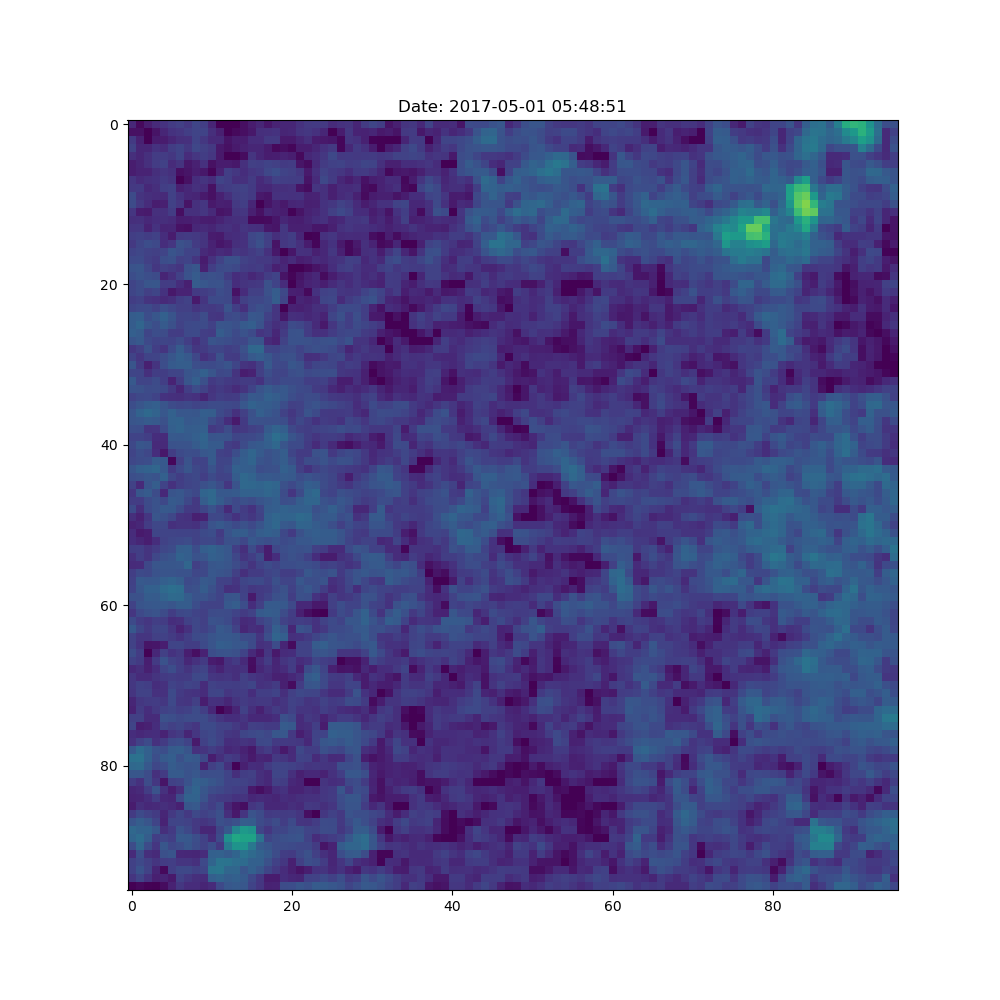
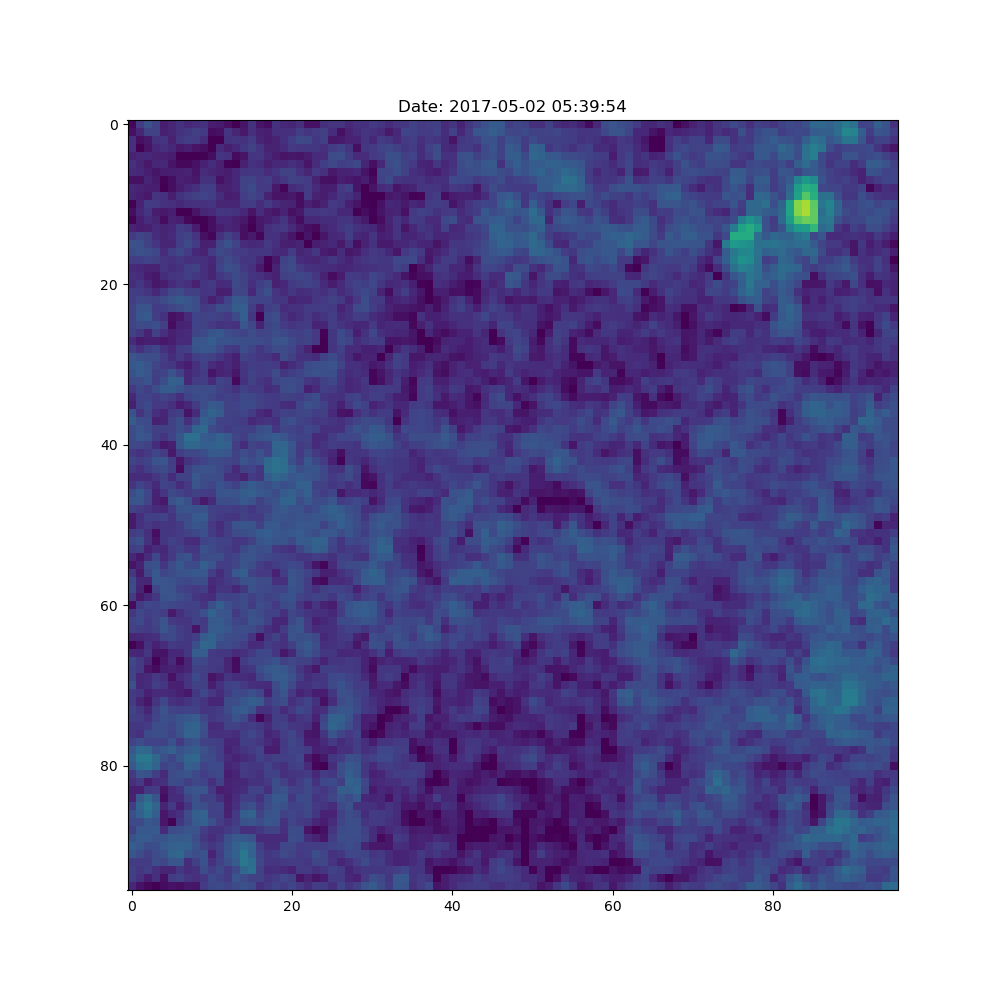
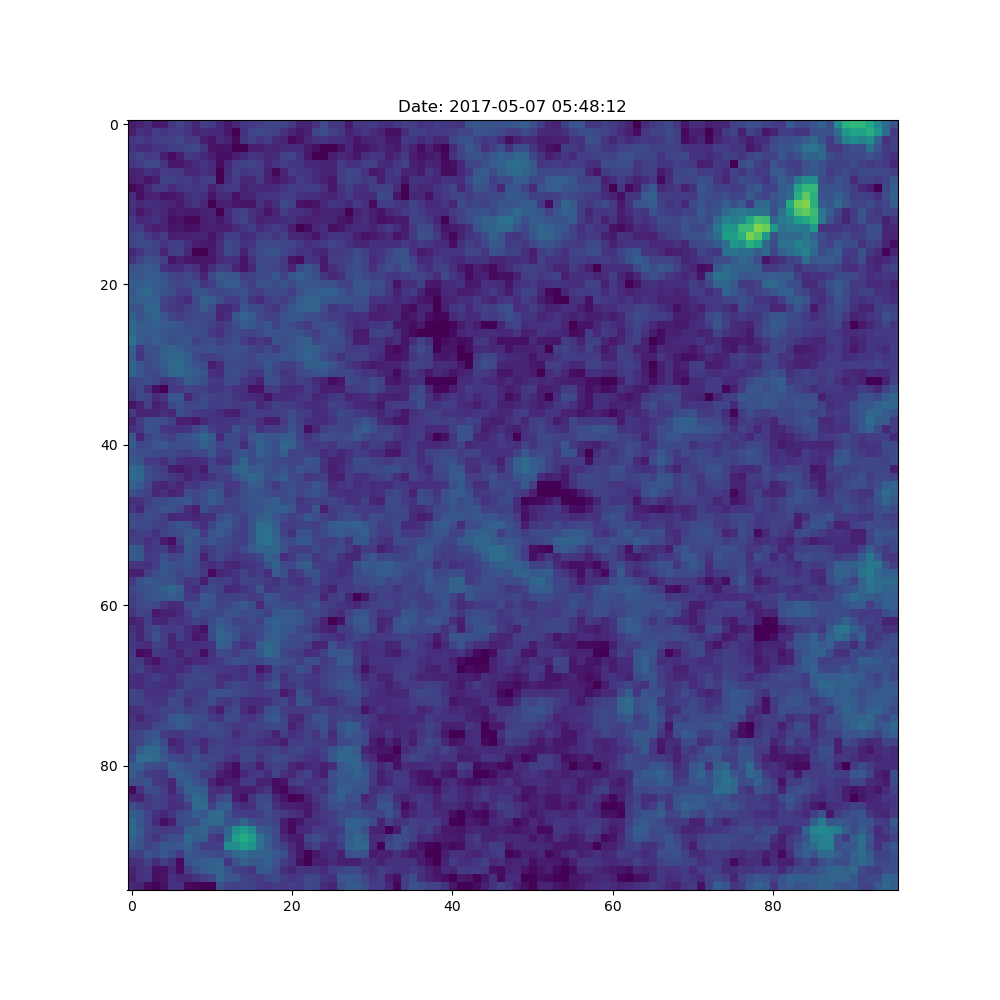
I am using the following code to get a time series of SAR data between 2017-05-01 to 2017-08-31 for a bbox which returns 41 images (e.g. for the dates MAY 1,2, 7,8, 13,14…). However, it appears that the images on may 1 and may 2, may 7 and may 8, etc., are shifted with respect to each other. But images for may 1, 7, 13, … are fine, and also may 2, 8, 14, … are also fine . Is it because the data on subsequent days is from two different platforms? If so, and if possible, how can I filter based on platform so that the data is consistent?

download_task = SentinelHubInputTask(
data_collection=DataCollection.SENTINEL1_IW_DES,
bands_feature=(FeatureType.DATA, “BANDS”),
resolution=10,
bands=[“VV”, “VH”],
time_difference=datetime.timedelta(minutes=120),
cache_folder=“cached_data”,
)
save = SaveTask(EOPATCH_FOLDER, overwrite_permission=OverwritePermission.OVERWRITE_FEATURES)

workflow_nodes = linearly_connect_tasks(
download_task,
save,
)

workflow = EOWorkflow(workflow_nodes)
time_interval = [“2017-05-01”, “2017-08-31”]

download_node = workflow_nodes[0]
save_node = workflow_nodes[-1]

bbox = BBox(((485760.0, 6179520.0), (486720.0, 6180480.0)), crs=CRS(‘32632’))
idx = 0
result = workflow.execute({
download_node: {“bbox”: bbox, “time_interval”: time_interval},
save_node: {“eopatch_folder”: f"eopatch_{idx}"},

})

Hi Muhammad,

Some more information would be appreciated, for example, visualising the shift as well as defining how large the shift is. In addition, you can specify either Ascending or Descending orbits which may solve your problem. You can find information in the documentation on this here.

Hi William,

Sorry for not being precise. I am explicitly using the DataCollection.SENTINEL1_IW_DES, so the orbit parameter should not be an issue. I have attached the data for may 1, may 2, may 7 and may 8. You can notice the two blobs on top right which gives a difference of 2 pixels, so 20m.


I have tried orthorectification, which seems to have aligned the images (attached as below). However, i am still confused that the features in the data are similar for may 1, may7 and so on… and also for may 2, may 8, and so on… but if I compare may 1 and may 2 data, they seem to be not consistent in terms of patterns. Why could that be?


Thank you in advance😊

-Rizwan

Did you try my suggestion using only ascending or descending orbits?

It does not help either…

download_task = SentinelHubInputTask(
data_collection=DataCollection.SENTINEL1_IW_DES,
bands_feature=(FeatureType.DATA, “BANDS”),
resolution=10,
bands=[“VV”, “VH”],
time_difference=datetime.timedelta(minutes=120),
cache_folder=“cached_data”,
aux_request_args={
“orbit_direction”: “DESCENDING”,
‘processing’: {
‘orthorectify’: True,
‘backCoeff’: ‘GAMMA0_TERRAIN’
}
}

)

OK thanks for confirmation. Without more knowledge about the area of interest, it is difficult to say, however some questions you can ask are:

  • is the shift constant across the whole area of interest?
  • is terrain impacting the result? Perhaps, the terrain is uneven which will inevitably cause a shift despite correction.
  • is the target of interest always a constant or is the spectral response likely to change too?

Hi William,

After enabling orthorectification, the shift has been corrected. But the question that I am trying to ask now is that the patterns in the data on May 1 and May 2 are different, while the pattern of May 1 is similar to May 7 data, and the pattern of May 2 data is similar to May 8.

You can see from the last four figures if you notice there is a blob at bottom left in May 1 and May 7 data but it is not there in May 2 and May 8 data. This makes me think that it is because of the two satellites, Sentinel-1A and Sentinel-1B. Is there a way I can filter the days based on which satellite was used?

The response should not change too much since its an agricultural area and not much change is expected in two days. Also, May 1 and May 7 data have similar response, and so there must be something else going on… ?

Currently, there is no option to filter by 1A and 1B.

This a screenshot of the Catalog API response for your AOI and Sentinel-1 GRD. In fact the imagery collected on 1st/7th May are A and B. It is the same for the 2nd and 8th May. So, I don’t think we can blame the different platform for this change.

If you look at the image footprints, you will see they are not consistent with Sentinel-1. Therefore, the angle of measurement will be slightly different, so it is likely you would expect some changes depending on the angle that the image was collected.

To find out more about SAR image interpretation i would recommend enrolling in the EO College Course: Echoes in Space. This should help give you a basic understanding of SAR imagery analysis which is very different from multispectral image analysis.

Hi William,

Yes, I understand the differences now. Thank you very much for your help!