Hi sentinelhub teams ,
I would like to download images for my area of interest from sentinel-2A .
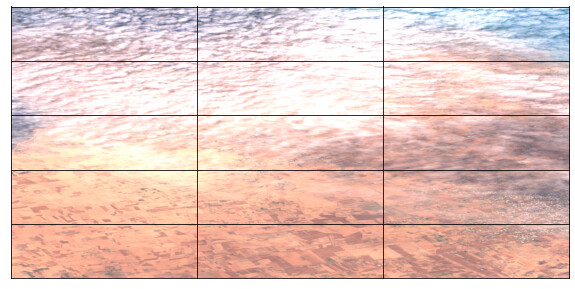
The download is done successfully but when I try to display the result I don’t get the full image.
Any help please!
Hi sentinelhub teams ,
I would like to download images for my area of interest from sentinel-2A .
The download is done successfully but when I try to display the result I don’t get the full image.
Any help please!
Hi @imenltaifi,
It’s hard to help without knowing how you got to this step. Can you give more information on your workflow: what tools have you used, what you have done, what errors you have run into?
Hi @maxim.lamare
I worked with eolearn and my workflow is runned successfuly , I didn’t have any error in my report file but also When I try to display the result I don’t have the full image !
Good, we have ruled errors that out. Would you mind sharing the date range, location and maybe the contents of your report files? To comment on the problem, we need to understand what you have been running.
Hi @maxim.lamare
My date range is :
time_interval = ['2017-01-01', '2017-01-31']
here you find my report file
https://www.dropbox.com/s/e4w75xin90x5j72/report.html?dl=0
and this is my geojson file
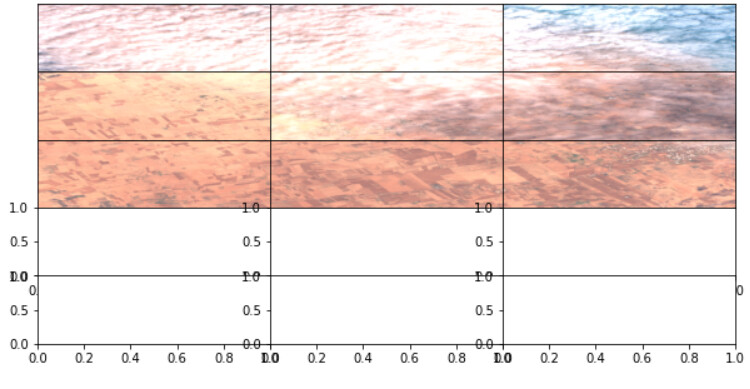
Because of the size of your AOI, you have less patches as the example workflow. Therefore you need to adapt the plotting function to fit your patches. The following code (note line 3) which divides your grid into 3 columns should do the trick:
for i in tqdm(range(len(patchIDs))):
    eopatch = EOPatch.load(f'{path_out}/eopatch_{i}', lazy_loading=True)
    ax = axs[i//3][i%3]
    dates = np.array(eopatch.timestamp)
    closest_date_id = np.argsort(abs(date-dates))[0]
    ax.imshow(np.clip(eopatch.data['BANDS'][closest_date_id][..., [2, 1, 0]] * 3.5, 0, 1))
    ax.set_xticks([])
    ax.set_yticks([])
    ax.set_aspect("auto")
    del eopatch
fig.subplots_adjust(wspace=0, hspace=0)