If I use e.g. the NDVI eval script from the dashboard config utility, I get a response like this:
‘data’: [{‘interval’: {‘from’: ‘2020-04-26T00:00:00Z’,
‘to’: ‘2020-05-01T00:00:00Z’},
‘error’: {‘type’: ‘EXECUTION_ERROR’}},
I get it working by adapting the eval script to be like in the examples here: https://docs.sentinel-hub.com/api/latest/api/statistical/examples/ (i.e. named outputs), but what exactly is the problem/what exactly does the stats API require from my eval scripts?
I don’t see it documented, but the res arguments are in the units of the coordinate reference system specified along with the request geometry. This means if you use epsg: 4326 (units: degrees), but res=10, you always get only one sample back. Therefore:
2a. Leaving out the res argument seems to fall back to the native resolution of the data, what ever crs you use. Is that correct?
2b. What happens if one uses a res larger than the request geometry? If I set res as 100 m, but the geometry is only 50 m in radius, does the response consider the data outside the geometry?
2c. Is there any advantage in speed or processing units to using large res values? Is there any motivation for me to change that from 10 (or just leave it out as in 2a)?
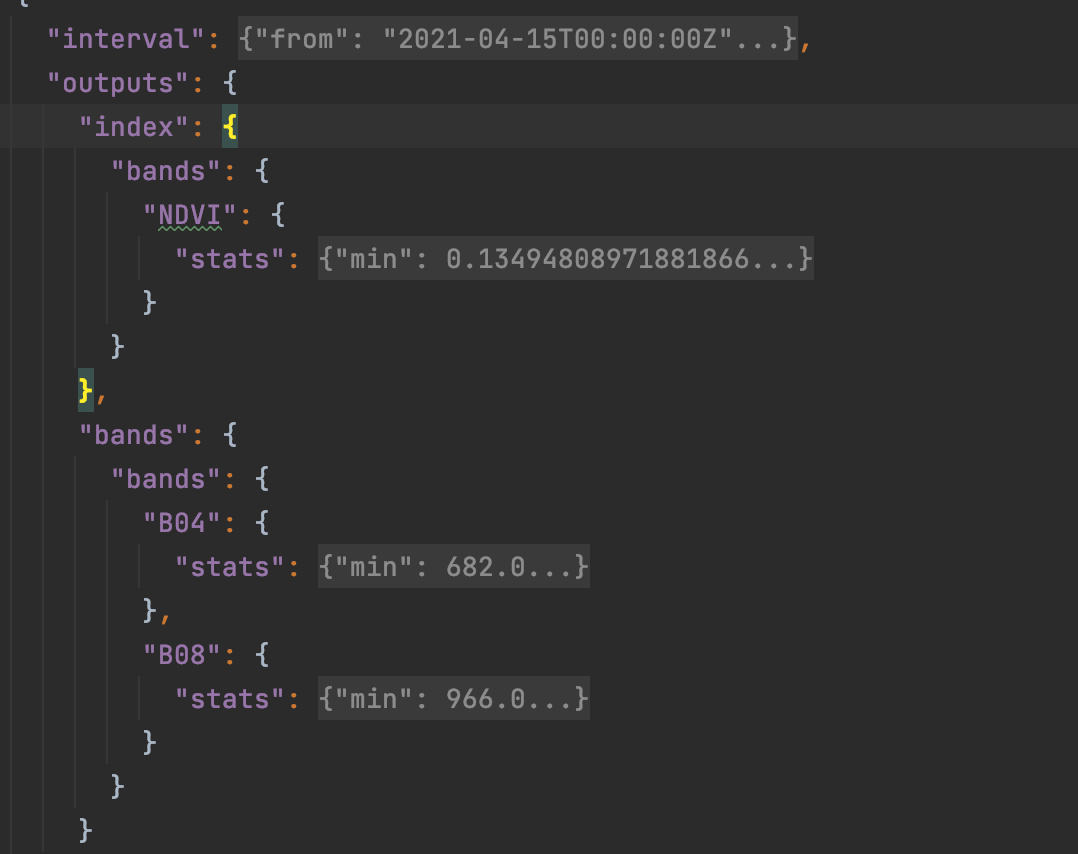
I suspect your NDVI layer in dashboard doesn’t have the dataMask output, which is a mandatory output of evalscript for it to be useful for Statistical API. Because of this requirement, the result of the evaluatePixel function should then be a dictionary; all the other outputs could be in the default output, but at least personally, I like the named outputs.
Rather simple, but “explicit” evalscript is this one:
According to API docs, the input>bounds parameters of the Statistical API request are the same as for Process API. Please see docs for details (the docs also state resolution: Spatial resolution used to calculate the width of the sample matrix from the input.bounds . Its units are defined by the CRS given in input.bounds.properties.crs parameter.`)
2c) I’d say it depends on your case. If you want to get a rough statistics of large areas, then absolutely, reduce the resolution substantially: you will get “good enough” stats much faster. You can always run an experiment to find the sweet spot.
I’ll have to come back to you with answers for 2a and 2b. I have to check myself
2a) if neither res_x/res_y nor width/height parameters are specified, defaults will be used: width=height=256
2b) such request will result in an error. At the moment, the error message is misleading (it will say “The bounding box area too large.”)
your answer to 2a explains something:
I just found I’ve burned through A LOT more PUs than I would have expected. I was making requests in EPSG 4326 and just not setting height, width, resx or resy. So it was obviously using the default. Now I reproject to a UTM zone and set resx and resy=10, each request uses about 1/6 of the PUs!
So, if one cares about the PU cost, don’t leave resx/resy un set!
Another thing to take into account is the fact that statistics of 40 pixels with 10-meter resoution will be similar to statistics of 10 pixels with 20-meter resolution (over the same area), yet you will use 4-times less PUs. Therefore, if you are performing your analysis over the large area, make sure to down-scale, unless you are really certain you want to do it at full-res.
Thanks for the tip Grega, but maybe you can illuminate something:
None of this shows up in the usage history yet, so I can only estimate the PU cost by looking at my monthly PU remaining quota.
I have a test request. At 10 meters, the PU quota goes down by 10, then a few seconds later, goes down by about another 1 PU.
At 20 meters, it goes down by 10 PU, then goes up again by about 8 PUs (so the overall cost is about 2-3 PUs).
Same happens at 30 meters, it geos down by 10 PUs, then seems to “refund” some.
Because of this, I initially thought that all resolutions had the same PU cost…
What’s going on?
Also, this service is really great (especially now that I’m using ca.1/20 of the PUs I was originally!)!
As a general note - the PU calculation of this service should be exactly the same as for process API (e.g. if you would have done individual process API requests to get the data, then calculate the statistics yourself).
Your account (I am assuming you are using user id 1cb70d3a-MASKED) is set to 30.000 processing units per month. this means that every 89 seconds a new PU is added to your account, making it difficult to calculate on your side on what exactly is happening. (as a side note; we will soon change this model and refill the account once per month, on 1st of the month).
You are making quite a few requests, so it is difficult to do individual analysis. However, what I notice:
all requets are “small ones”, below the min order threshold, so being calculated as 0.01 PU in terms of “size”.
most of the requests done in the last hour, are of 2.64 PU each
the rest are all over the place, from 2 to 15 PU (at least those I’ve looked into)
The first bullet above is relevant as it is not in line with your finding that setting resolution does any difference (there is a chance that size is recorded wrongly in our logs, but still correctly applied in calculation).
I am guessing (as I do not have insight in details of your requests) that the variation is mostly related to number of observations and number of bands.
If you find some inconsistency, it would be great to report some more details, so that we can look into it. There is a chance that we have a bug in StatAPI PU calculation, it’s a new service.
The easiest way to provide us debug info is to create a new OAuth clientID and use that one to just make a few requests, e.g. 1 minute apart, and let us know what you have done (we do not keep all the details of your request in our logs). Then we can compare this with individual logs.
Good to know it should be same PU calc as the Process API.
Why the change to granting all PUs on 1st of month. I would vote against that if it were a democracy…
If you were to look back at the requests before ca. 5pm yesterday, you should see they were all much larger. 2.64 is expected after I explicitly set the resolution parameters.
I’m confused - if my requests are smaller than the min-order threshold, should or should not the resolution make a difference?
I will do some tests with a new OAuth ClientID and let you know by email.
Thanks for the named outputs example.
If the datamask is required as a separate named output, is it possible to use data fusion with the stats API? Because then one would need a separate dataMask output for each of the data sources?
Is this possible?
Before even getting to how to handle dataMasks, I can’t even get it to work with named data sources:
e.g. having this in the request:
{
“type”: “S2L2A”,
“id”: “S2”,
“dataFilter”: {
“mosaickingOrder”: “leastCC”
},
and this in the evalscript:
input: [{
datasource: “S2”, …
Full refil at 1st of the month is coming as we realised that the existing system is too confusing for many users. We field questions related to this on a weekly basis. In practice it is also better for the users as it guarantees that someone can continuously consume all monthly credits, if they wishes so.
They were indeed larger, but the “size factor” was always 0.01. It might be, though, that this is logged wrongly.
As long as requests are smaller than min-order threshold (i.e. 51*51px), they will be counted the same. If you, however, increase resolution to e.g. 1m, the request’s size will increase. But, at least according to the logs, they never got over 0.01.
That also means that if one accidentally burns through their credits before the month end (as just happened to me), they are completely blocked (rather than just significantly slowed down) unless they get out the credit card…
3 & 4: that’s odd as I was seeing a difference between using 10 m and 20 m - I guess all the requests you saw were 20 m and thus below the 0.01 threshold, but my occasional tests earlier at 10 m were larger than that…
Does the stats API support e.g. Landsat 8, MODIS or Sentinel 3 yet? Just experimenting and didn’t get any of them to work. With original end point, just get “bad request”. If I switch the end point (https://docs.sentinel-hub.com/api/latest/data/), I get “503 Service Unavailable”.
There are other ways to earn PUs, i.e. by earning “love” by contributing to the community (check your Dashboard ).
and 4. - the PUs do for sure depend on resolution as there are more pixels processed. But only as long as the "area’ (in pixels) is larger than 51x51px.
 ).
).