Systematically downloading regular time-series mosaics

Hi all,

This is Enes! I am the lead data scientist in an agri-tech company, and we are considering cooperating with Sentinel-Hub for our entire satellite data operations. We have been working on understanding the pipeline. We dived into the documentation page and Medium blog posts. However, we are confused and have several questions.

Task: Crop classification and field boundary detection at a large scale.

In this post, I only focus on our requirements for crop classification because it covers the latter.

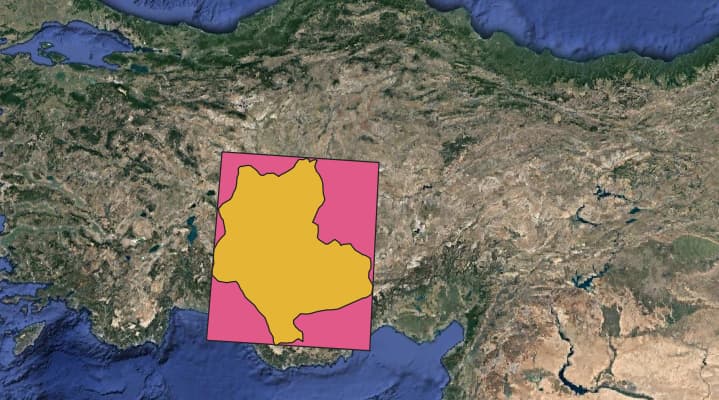
We aim to get regular time-series satellite images for 26 different regions determined. For a given region (ideally the orange area, not the pink one), we have three different scenarios:

Scenario 1: Download weekly Sentinel-2 median mosaics. Impute the cloudy pixels with temporal imputation. Download weekly Sentinel-1 (radar) mosaics.

Scenario 2: Allowing a dynamic time range for Sentinel-2 median mosaics. In this case, I expect the time range expands until we reach a pre-specified cloudless pixels percentage. For instance, in March we might have a monthly mosaic, but in July, we might have more frequent cloudless mosaics. Download weekly Sentinel-1 (radar) mosaics.

Scenario 3: Download monthly Sentinel-2 median mosaics (assuming that the percentage of cloudy pixels is below a certain threshold). Download weekly Sentinel-1 (radar) mosaics.

Questions

1- What is the optimal way to implement the scenarios above? Can we implement the mosaic with a dynamic time-range case in Sentinel-Hub?

2- Do you provide any services for the temporal imputation in Scenario-1?

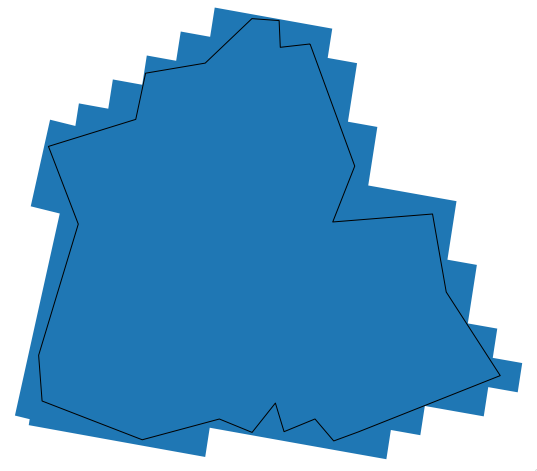
3- Is it possible to download the orange (or pink) mosaic i.e. can Sentinel-Hub take care of the stitching process?

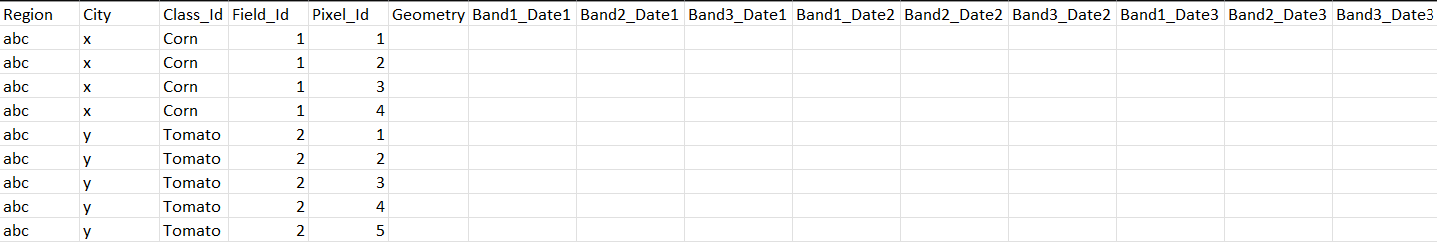
4- We have ground-truth field samples. We aim to construct a tabular database on PostgreSQL for our machine learning operations. If we provide the vector data set, do you have any service to help us fill the database in a column-wise expanding manner based on the scenarios I mentioned above? Please see the visualization on the second post to better understand database structure.

You can find an example region below.

The Bbox = (31.3113317420176180, 36.3997020087171350, 34.4186815229763141, 39.2964617824208986).

Finally, could you please provide us with a trial period for Batch Processing API to test the system?

Thank you very much,
Enes

Visual representation of the tabular data set

Hi Enes,

In principle Sentinel Hub is capable of providing data for the scenarios you mentioned.

To address your questions:

  1. Based on the example geometry you provided, the optimal way would be to use Sentinel Hub Batch processing API as you rightly presumed. The median mosaic can be defined and calculated within an Evalscript, the mosaic will then be processed as tiles (of one of this sizes ) that cover your geometry and delivered directly to a specified object storage. The data can then be accessed directly from the object storage or as Sentinel Hub layers, depending on how the data is to be used. If you haven’t come across it yet, you can have a look at examples of cloudless mosaics evalscripts in this cloudless mosaic blog post.

Regarding the dynamic time -range case, by ‘‘cloudless pixels percentage’’ does this refer to the percentage of pixels based on the whole AOI (as in spatially) or per pixel (as in temporal wise) ? For the former case, one option is to use Sentinel Hub statistical API to determine the percentage of cloudy pixels within the AOI.

  1. I imagine temporal imputation really depends on the availability of valid pixels. Within an evalscript this can be achieved by fetching valid pixels within a time range and performing a linear interpolation. In this blog post you can find an example of such an evalscript.

  2. As mentioned above, Batch Processing output is always delivered in tiles to an S3 bucket which will overlap your geometry. See the screenshot below. If by stitching you mean merging the processed tiles into one image ? this can be easily done with tools like QGIS or with such an example script .

Image Pasted at 2022-5-11 15-30

  1. For this I would suggest using the statistical API, It takes input geometries and outputs band statistics (e.g mean value) which can be aggregated per day. At native resolution and for a single date, the mean value would simply be the actual pixel value. Assuming that the field samples are point coordinates, these can be converted to bounding boxes and defined in such a way that each bbox is within a Sentinel 2 pixel. The output is in json format, which is versatile to work with.

I would recommend that you first test your workflow with Processing API on a smaller AOI (for this your current trial subscription is sufficient), then you can scale up with Batch Processing API once you determine the results are as anticipated .

Hope that gives you a better insight, please do get back to us if you need further clarifications

All the best

1 Like

Hi @dorothyrono,

Thank you very much for your answer.

  1. We read the cloudless mosaic blog post, and tested the eval scripts with Processing API on smaller AOIs. It works as expected.

Regarding dynamic time range, I refer to the spatial-wise percentage. So, I expect an example algorithm works as follows:

  • Construct a 7-day mosaic.
  • Check if the cloudless pixel percentage is greater than the pre-specified threshold. If it is, download the tiles into the S3 bucket.
  • If the cloudless pixel percentage is less than the pre-specified threshold, wait for one more week.
  • Construct a 14-day mosaic.

… and so on. We aim to maximize the frequency of mosaics for a given AOI to get time-series information as much as possible. If you have any suggestions regarding this, we are more than welcome.

  1. Once we construct the mosaics with the algorithm above, I expect we will have valid pixels available in most cases. Therefore, I assumed that it is possible.

  2. Exactly, I mean merging processed tiles into a single image. Thank you for the reference script. We agree that it can be done easily.

  3. That is great! I have a follow-up question. Can we adjust the Statistical API workflow based on one of the scenarios mentioned above? The values written on the database have to be compatible with the downloaded images. Also, do you have a reference post about how the workflow looks like? Or, could you please elaborate more on how we ensure the integration with the PostgreSQL database on Amazon Web Services.

My colleague is already testing the Processing API on smaller AOIs. We are trying to figure out realistic parameters for the scenarios. Then, we can scale up for the batch process.

Thank you very much. Your answer really helps.

Looking forward to hearing from you,

Kind regards
Enes

Great that you are having a bit of success on this, it is always worth to start with small scale then scaling up. To answer your follow up question, yes, here are the possibilities:

  • It is convenient that with Batch Processing, the output data stored in the bucket can be re-ingested back to Sentinel hub as private collections, with the create collection option. From these collections (mosaics) the band values can then be extracted on the fly with Statistical API
  • Alternatively, especially from 1 &3 scenarios where the date range is fixed, you can extract the ‘median’ values (on the fly) without having to actually download the mosaic images or use the downloaded ones.You just need to specify the same script in Statistical request, as the one used for downloading the mosaics.
  • Statistical API is mentioned (or used ) quite a lot in this Area Monitoring blog series , but also the examples provided here provides a typical workflow.
  • I believe Python provides several integration possibilities, since the output JSON format can be easily read into any format, I believe PostgreSQL too. You will surely find more insights on this from Google Search.

Best regards

1 Like

Hi @dorothyrono,

Thank you very much for your answers.
Kind regards