when I select dates and load the results, I can only visualize one of results. when I try to visualize the next nothing happens, the data does not load. sometimes there is no “grid” of results layers
Hi @sergey,
We are looking into the issue concerning the Visualize button. For now, it should still work if you select a result with the button and then select a visualization option like True color, False color or the listed indices. Please report back here if this does not work for you.
Could you briefly explain what you mean by the grid of result layers?
sometimes there is no “grid” of results layers
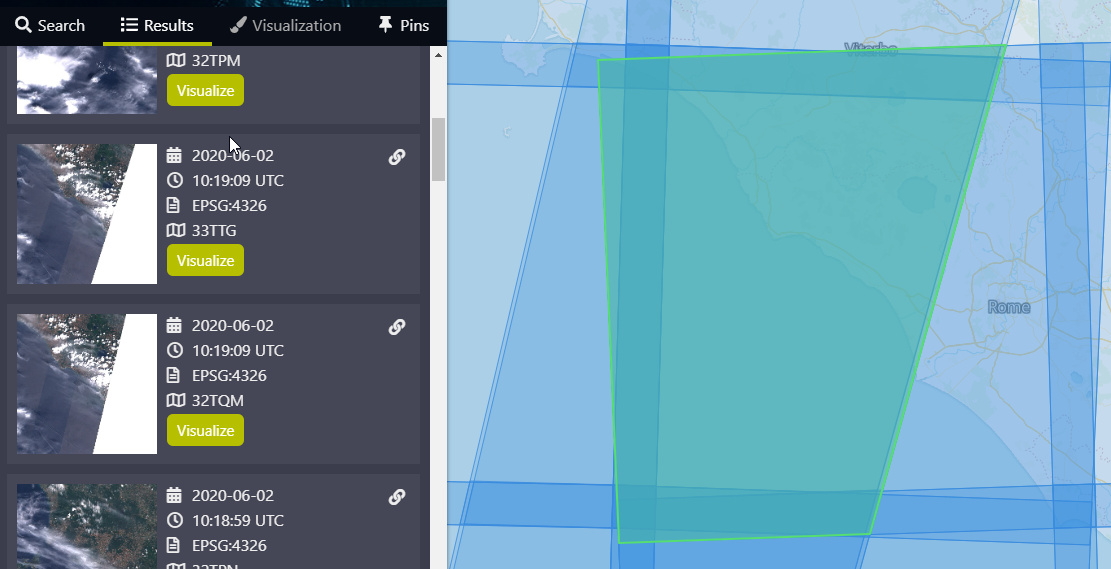
Are you referring to the result footprints that are displayed in the map? Just to clarify, a small example screenshot:
Best, Max
Yes, I meant it.
But that is not the point, because it rarely happens. The biggest problem with the first part of my question. Look - I select the dates (for example, 01/01/2017 and 01/06/2020), select the maximum cloud coverage (for example, 3%) and click “Search”. Then the results appear, layers on the map. I click on them, select one of the images and click “Visualize”. Full surface images are loaded. Let’s say such an image does not suit me. I go to the “Results” tab and select another image, click “Visualize”, but nothing else happens. In general, I can only visualize one of the results. Next, I must to reload the page and re-enter all the data.
Yes, I checked, with “True color” it works, thanks. but it seems to me it’s not very convenient, sorry, my friend 
I probably edited my first answer while you were replying, but I am happy that helps you for now and you do not have to re-enter all the search parameters. We are communicating to fix the issue concerning the Visualize button and the footprints, thank you for reporting!
Best, Max
In case you didn’t notice it already @sergey , both issues have been fixed! Enjoy browsing!
Cheers, Max
thank you very much!