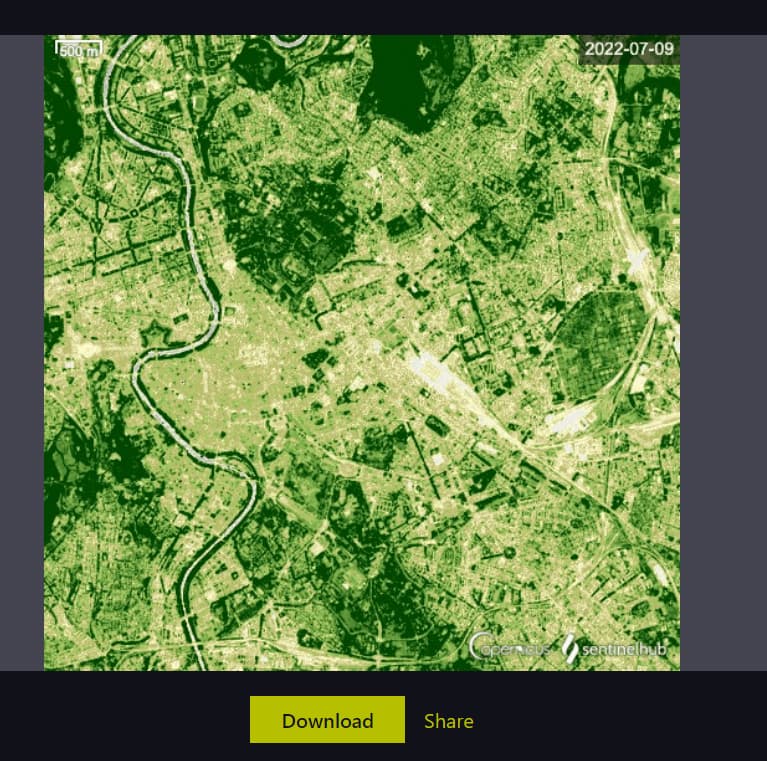
Hello, everyone!
I’m looking for assistance with adding a timelapse to my webGIS using an Evalscript. The Evalscript I’m using isn’t working, and I’m in need of clear and straightforward instructions on how to achieve this. Please provide guidance
here’s my script:
//VERSION=3
// Script to extract a time series of NDVI values using
// Sentinel 2 Level 2A data and  metadata file.
function setup() {
    return {
      input: [{
        bands: ["B04", "B08"],
        units: "DN"
      }],
      output: {
        bands: 1,
        sampleType: SampleType.FLOAT32
      },
      mosaicking: Mosaicking.ORBIT
    }

  }

  // The following function is designed to update the number of
  // output bands without knowing beforehand how many there are
  function updateOutput(outputs, collection) {
      Object.values(outputs).forEach((output) => {
          output.bands = collection.scenes.length;
      });
  }
  // function to generate a json file with a list of the NDVI
  // dates used in the analysis.
  function updateOutputMetadata(scenes, inputMetadata, outputMetadata) {
      var dds = [];
      for (i=0; i<scenes.length; i++){
        dds.push(scenes[i].date)
      }
      outputMetadata.userData = { "acquisition_dates":  JSON.stringify(dds) }
  }

  function evaluatePixel(samples) {
    // Precompute an array to contain NDVI observations
    var n_observations = samples.length;
    let ndvi = new Array(n_observations).fill(0);

    // Fill the array with NDVI values
    samples.forEach((sample, index) => {
      ndvi[index] = (sample.B08 - sample.B04) / (sample.B08 + sample.B04) ;
    });

    return ndvi;
  }
