True colour are Images too bright or extremely dark

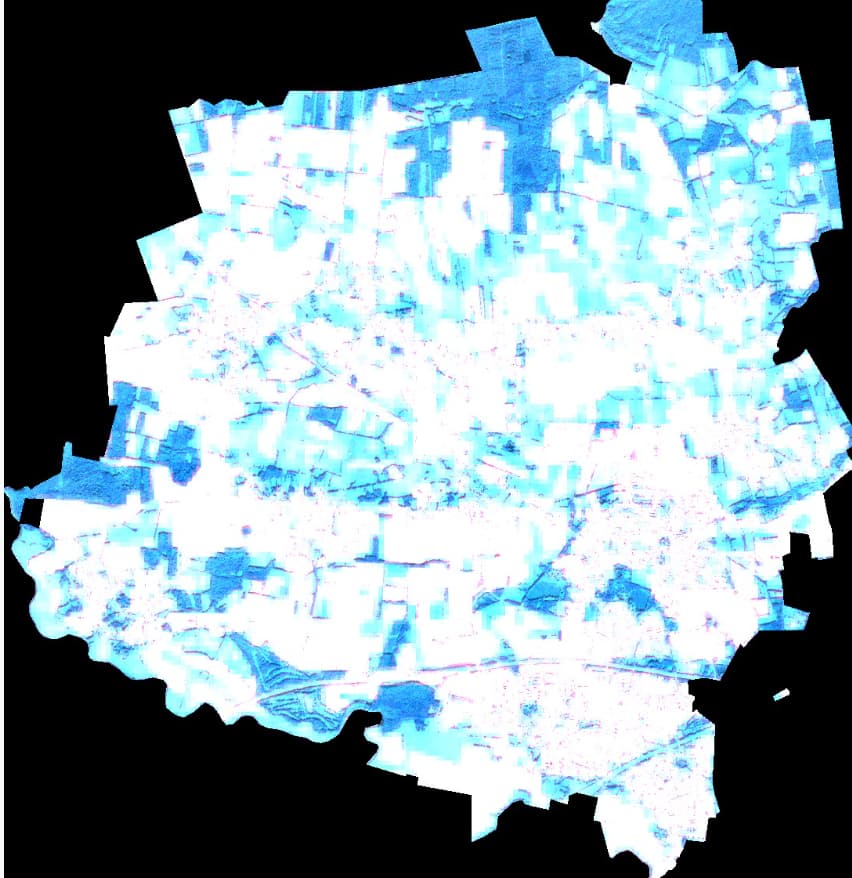
I tried to increase the time window to up to 8 months and set least cloud cover to 15 percent, but I am getting images that are too bright or completely dark, although the area is just 74.5 km2 which is large enough to not be completely dominated by clouds I assume. Is there a work around to get decent images for time series analysis of this specific area.

example image (11 months least CC mosaicking)


example image (3 months least CC mosaicking)

The code used:

/VERSION=3
    function setup() {
        return {
            input: [{
                bands: ["B01", "B02", "B03", "B04", "B08", "B05", "B06", "B07", "B8A", "B11", "B12"],
                units: "DN"
            }],
            output: {
                bands: 4,
                sampleType: "INT16"
            }
        };
    }
    function evaluatePixel(sample) {
        return [sample.B01,
                sample.B02,
                sample.B03,
                sample.B04,
                sample.B05,
                sample.B06,
                sample.B07,
                sample.B08,
                sample.B8A,
                sample.B11,
                sample.B12];
    }

Update: I was able to adjust the histogram to get to near natural colours, but there are still the white patches.

I’ll be happy to know how I can get rid of this effects. Thank you!

Hi Aswin Manohar!, in your Evalscript you are returning many bands, why don’t you try this example for true color:

      //VERSION=3
function setup(){
  return{
    input: ["B02", "B03", "B04", "dataMask"],
    output: {bands: 4}
  }
}

function evaluatePixel(sample){
  // Set gain for visualisation
  let gain = 2.5;
  // Return RGB
  return [sample.B04 * gain, sample.B03 * gain, sample.B02 * gain, sample.dataMask];
}

Thanks for the answer @adrian.dipaolo. we have an in-house sentinel-2 processing pipeline for few analysis and true colour image is a part of it. I’d prefer get all the bands and do our own processing.

You are returning only 4 bands in your output, in this case you should fix your current Evalscript and set the output to 13 bands,

//VERSION=3
    function setup() {
        return {
            input: [{
                bands: ["B01", "B02", "B03", "B04", "B08", "B05", "B06", "B07", "B8A", "B11", "B12"],
                units: "DN"
            }],
            output: {
                bands: 13,
                sampleType: "INT16"
            }
        };
    }
    function evaluatePixel(sample) {
        return [sample.B01,
                sample.B02,
                sample.B03,
                sample.B04,
                sample.B05,
                sample.B06,
                sample.B07,
                sample.B08,
                sample.B8A,
                sample.B11,
                sample.B12];
    }

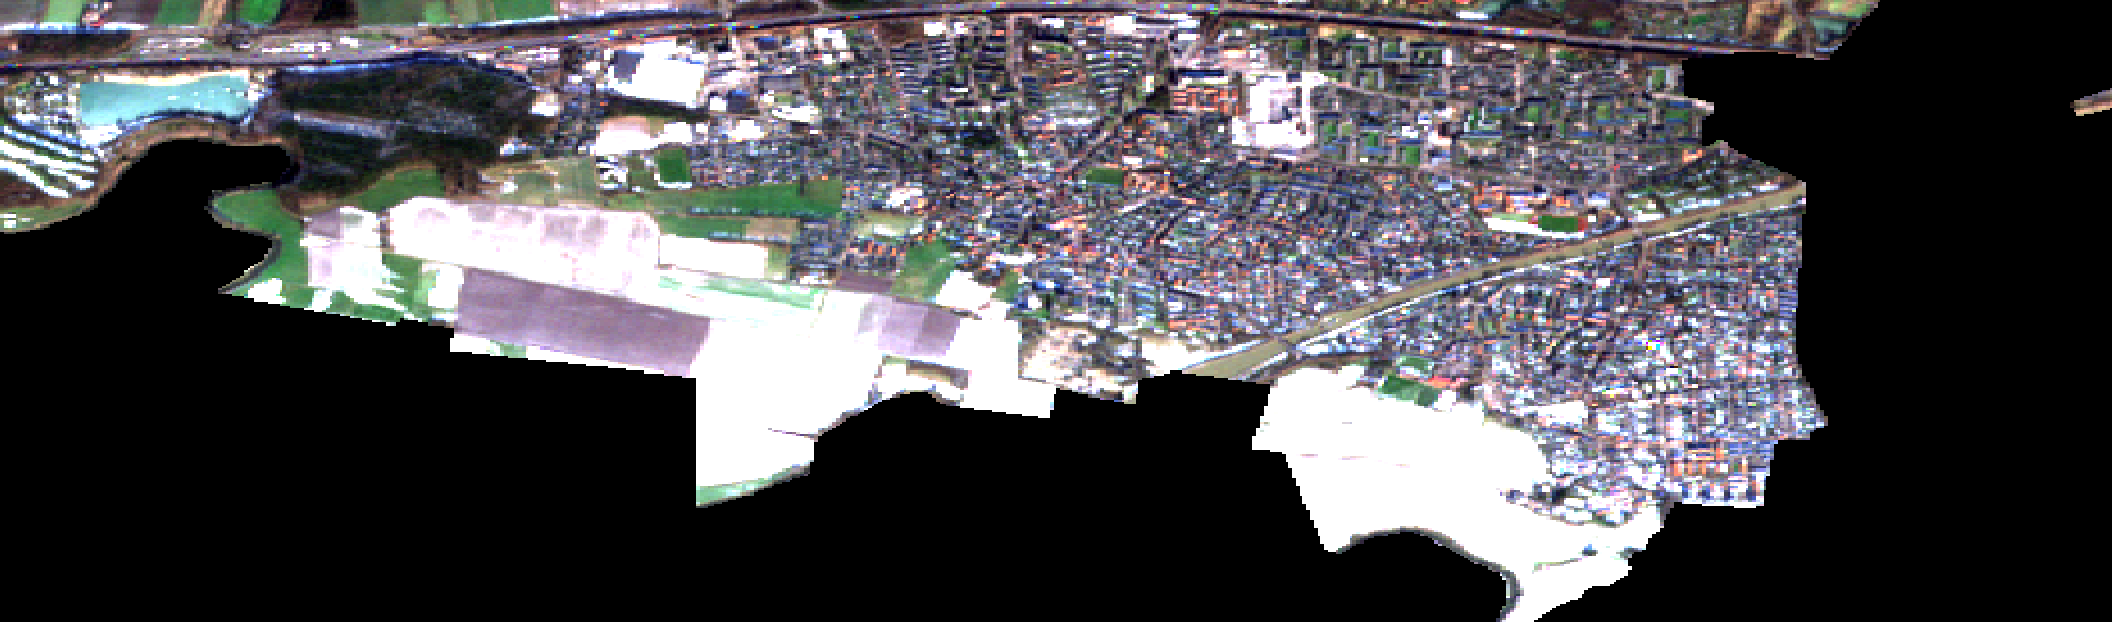
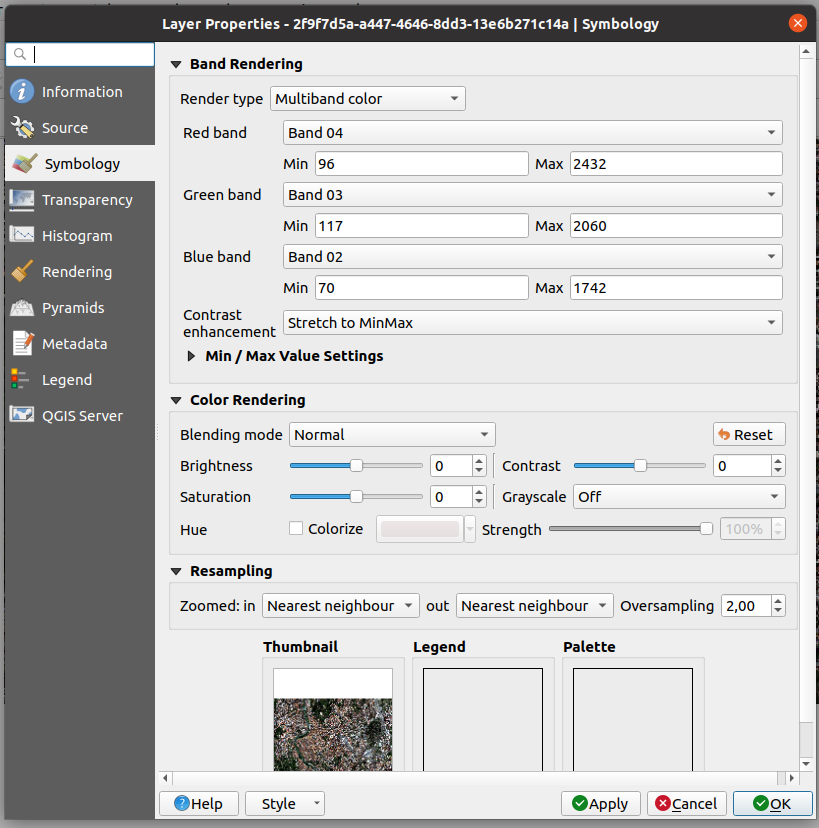
Then when you open the TIFF in Qgis, you should double click the layer in the Layers Panel and set in the properties the bands to B4 (Red), B3 (Green) and B2 (Blue) as you can see here:

For more information about the spectral bands, you can check this documentation about the Sentinel-2 L2A:

Sorry, that was the wrong evalscript. I return only 12 bands.

So, were you able to fix the problem?

Sorry, I was away! I just managed to manipulate the histogram in QGIS, but the white patches still remain

Hi again!, would it be possible for you to provide the curl request you get in the Requests Builder?

I solved the issue @adrian.dipaolo

This topic was automatically closed 60 days after the last reply. New replies are no longer allowed.