Utilizing Scene Classification Algorithm within QGIS for Polygon Areas

Hi everyone,

I’m looking to leverage the Scene Classification algorithm provided by Sentinel Hub, specifically within the QGIS software. My objective is to classify specific areas within polygons of interest.

I have a set of polygons delineating regions I’d like to analyze. My intention is to apply the Scene Classification algorithm to these defined areas to gain insights into land cover and features present within each polygon.

Could you kindly provide guidance on the most effective approach to achieve this within the QGIS environment? I’m keen to understand the step-by-step process and any recommendations for seamless integration with QGIS.

Thank you for your time and expertise. Your insights will be greatly appreciated.

Best regards,

Could anyone help me with this issue?

Hi @cirotccmbauspesalq2 ,

Could you please share the workflow you’d like to achieve in QGIS environment?

As I mentioned in another thread, you could actually get zonal statistics and zonal histogram with Statistical API. We also support Batch Statistical API which allows you to request zonal statistics/histogram for multiple polygons.

Hello @chung.horng,

Thank you for your response and assistance. I appreciate your guidance.

To clarify my workflow in the QGIS environment, what I am attempting to achieve is utilizing the images from Sentinel Hub to classify the areas within specific polygons in QGIS using the available Scene Classification algorithm.

My goal is to classify these polygons to determine which of them fall into the Scene Classification class 4, which is vegetation.

Currently, I have taken the following steps:

  1. Loaded the polygons of interest into QGIS.
  2. Added a WCS layer that I configured through EO Browser with the Scene Classification algorithm.
  3. Used the built-in QGIS “Zonal Statistics” tool to inspect the pixel classifications within the areas of interest.

However, I’m encountering a challenge. When I add the WCS layer configured in EO Browser to QGIS, it only displays three bands (Red, Green, and Blue) instead of showing the 11 land use classification classes available in the Scene Classification algorithm. This limitation is making it difficult for me to generate the classification provided by the algorithm.

Considering this, I’ve decided to re-evaluate my workflow to ensure its correctness. Could you kindly provide guidance on how to perform the classification using the Scene Classification algorithm based on the scenario I’ve described above?

Thank you once again for your time and support. Your insights are highly valued.

Best regards,

Ciro

Hi @cirotccmbauspesalq2 ,

When I add the WCS layer configured in EO Browser to QGIS, it only displays three bands (Red, Green, and Blue) instead of showing the 11 land use classification classes available in the Scene Classification algorithm.

I believe that this comes from the layer you’re using is a “visualisation layer”, which is the default one on the EO Browser. To get the actual scene classification mask (0-11) you need to return sample.SCL in sampleType: "UINT8". For example, the Evalscript below should give you the actual value of the class:

//VERSION=3

function setup() {
   return {
    input: ["SCL"],
    output: { bands: 1, sampleType: "UINT8" }
  };
}

function evaluatePixel(samples) {
  return [samples.SCL]
}

My goal is to classify these polygons to determine which of them fall into the Scene Classification class 4, which is vegetation.

If your goal is to classify your polygons based on zonal statistics/histogram, I don’t see a need to use QGIS in this case. The Statistical API and Batch Statistical API can simplify your workflow and bring the zonal statistic/histogram computation step to the cloud. My suggested workflow would be:

  • Make a (Batch) Statistical API request to get zonal statistics and zonal histogram of your AOI
  • Apply your classification algorithm to the polygon, e.g., the polygon is classified as vegetation if 80% of pixels fall into class 4.

This workflow can be easily automated as you simply need to make a API request and run a self-defined function to classify your polygons based on the api response. Is it a must for you to run zonal statistics/histogram in QGIS environment?

Thanks a lot, Chung! Should I paste it on the EO Browser layer I’m trying to configure?

Hello @chung.horng,

Thank you for your continued support and your insightful explanation of the workflow using the Statistical API and Batch Statistical API. I’m impressed by the potential of this approach to simplify the process and leverage cloud-based computation.

However, I must clarify that it’s a requirement in my current workflow to utilize QGIS. Despite my efforts, I’m encountering challenges in linking the layers in QGIS with the embedded classification algorithm, even when using the Evalscript you provided.

Given this context, would it be possible for you to offer a more detailed step-by-step workflow that demonstrates how to effectively link the EO Browser’s classification algorithm with QGIS? I believe having a clearer understanding of this process would greatly assist me in achieving my goals within the QGIS environment.

I truly appreciate your willingness to assist and your expertise in helping me navigate this integration.

Best regards,

Ciro

Hi @cirotccmbauspesalq2 ,

For a step-by-step guide, please follow the OGC API with QGIS integration webinar.

The Evalscript I provided should return actual SCL band value, i.e., 0-12, for each pixel. Note that in this case there is no visualisation (you might see a black layer) as all pixels fall in a range from 0 to 12 (a white pixel should have a value of 255). You can return samples.SCL/12*255 instead to get a grayscale visualisation.

Hi, Chung. I was in doubt because I just see a black layer on QGIS. And it turns out that QGIS is not running the zonal statistics with the WCS layer configured with the evalscript you provided. I’m trying to figure out what’s happening.

Once again, thanks a lot for your efforts to help me!

Regards!

Chung, should I replace this code with the already existing code that exists in the configuration mode on the Dashboard?

Hi @cirotccmbauspesalq2 ,

samples.SCL/12*255 is just a simple grayscale visualisation script. The Evalscript of the configuration layer only affects pixel values of the layer. It should not cause the zonal statistic tool not running with the WCS layer. I did investigate a bit on how to run QGIS built-in zonal statistic/histogram tool using WMS/WCS layer as input; unfortunately, I found nothing.

Ok, Chung.

But going some steps backwards: I’m not sure how the Scene Classification algorithm works. I simply want to classificate some polygons using it on QGIS. Do you have any suggestion of workflow to make it?

Thanks a lot again

Hi @cirotccmbauspesalq2 ,

Scene classification band SCL is one of the Sentinel-2 L2A products processed by Sen2Cor (see doc). We do not offer a scene classification algorithm for polygons, but you may make use of SCL data to decide what type of your polygon is, e.g., looking at the distribution of classes.

You could make Processing API requests to download SCL data of your polygons as TIFFs, then import them to QGIS for your post processing steps, i.e., running the zonal statistic/histogram tool.

Ok, Chung. I still don’t get why when I plot the images on QGIS (neither using a WMS or WCS layer) it doesn’t appear to me the 11 classes. Even using the code you provided, I can’t get those 11 classes on QGIS.

Hi @cirotccmbauspesalq2 ,

The script I provided returns a value from 0 to 11 for each pixel, representing different classes (please see the documentation for more info). It is not meant for visualisation as it is difficult for human eyes to tell the difference of grayscale between 0-11 out of 255 (0 is black and 255 is white). Instead, it gives you the actual value of the SCL band.

If you want to see the classes with a WCS layer, you need to use a visualisation script. For example, below is the script we use to visualises classes in EO Browser:

//VERSION=3

 function RGBToColor (r, g, b,dataMask){
	return [r/255, g/255, b/255,dataMask];
}

function setup() {
   return {
    input: ["SCL","dataMask"],
    output: { bands: 4 }
  };
}

function evaluatePixel(samples) {
    const SCL=samples.SCL;
    switch (SCL) {
    // No Data (Missing data) (black)    
    case 0: return RGBToColor (0, 0, 0,samples.dataMask);
        
    // Saturated or defective pixel (red)   
    case 1: return RGBToColor (255, 0, 0,samples.dataMask);

    // Dark features / Shadows (very dark grey)
    case 2: return RGBToColor (47,  47,  47,samples.dataMask);
        
    // Cloud shadows (dark brown)
    case 3: return RGBToColor (100, 50, 0,samples.dataMask);
        
    // Vegetation (green)
    case 4: return RGBToColor (0, 160, 0,samples.dataMask);
        
    // Not-vegetated (dark yellow)
    case 5: return RGBToColor (255, 230, 90,samples.dataMask);
        
    // Water (dark and bright) (blue)
    case 6: return RGBToColor (0, 0, 255,samples.dataMask);
    
    // Unclassified (dark grey)
    case 7: return RGBToColor (128, 128, 128,samples.dataMask);
    
    // Cloud medium probability (grey)
    case 8: return RGBToColor (192, 192, 192,samples.dataMask);
        
    // Cloud high probability (white)
    case 9: return RGBToColor (255, 255, 255,samples.dataMask);
    
    // Thin cirrus (very bright blue)
    case 10: return RGBToColor (100, 200, 255,samples.dataMask);
        
    // Snow or ice (very bright pink)
    case 11: return RGBToColor (255, 150, 255,samples.dataMask);

    default : return RGBToColor (0, 0, 0,samples.dataMask);  
    }
}

Note that with this script you will get red, green, and blue bands for visualisation purpose.

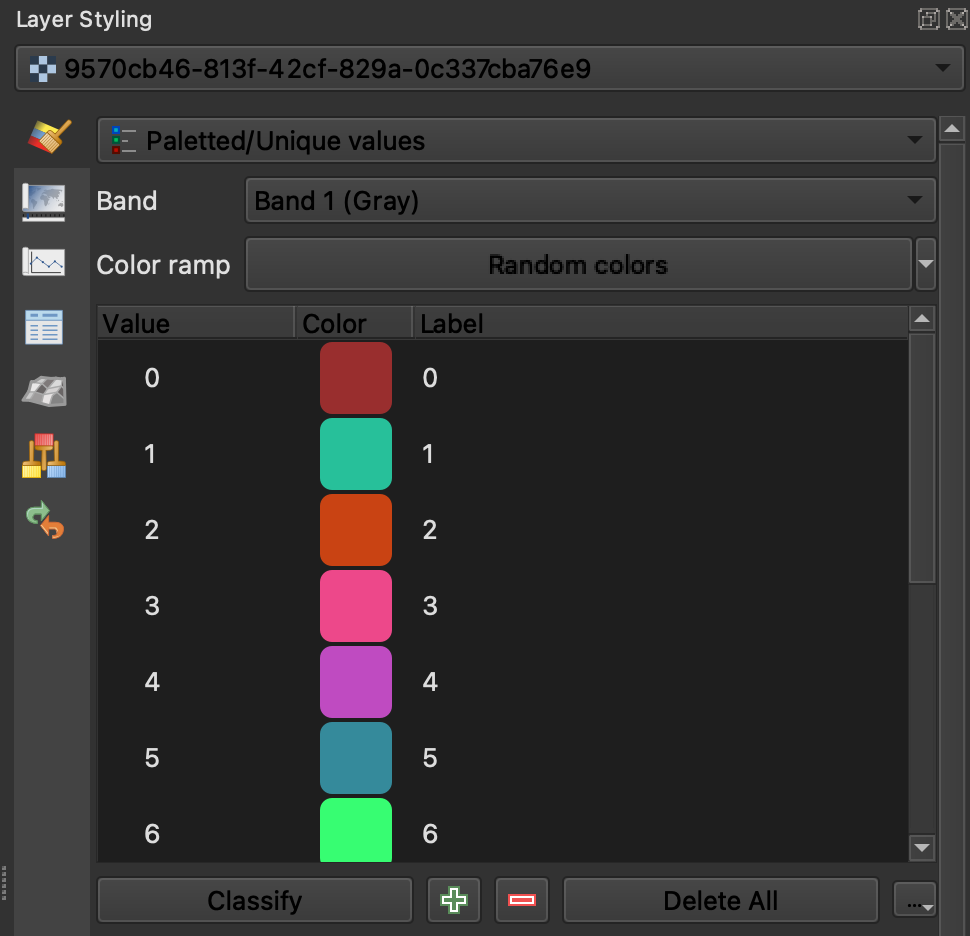
In short, you can either get a black WCS layer with actual SCL band values, or a colourful WCS layer with RGB values. If you want the actual SCL band value and the visualisation at the same time, please make a Processing API request with my script and assign color to your raster using Paletted/Unique values (Fig 1) in QGIS.


Fig 1

This topic was automatically closed 60 days after the last reply. New replies are no longer allowed.