I am attempting to construct a crop type classification pipeline based on label data from the Zindi farm pin crop detection challenge.
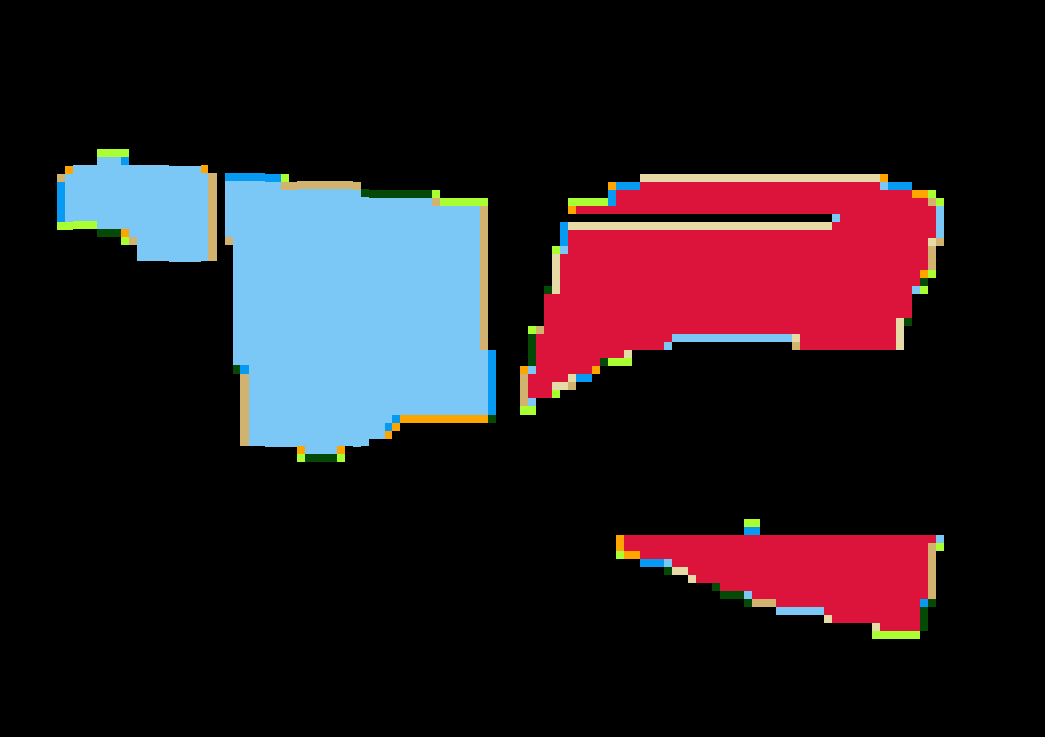
I am able to download the necessary data for my Area of interest and I am able to rasterize the label data. The problem I have is the rasterized labels have incorrect border values as shown in the image below (You can see all polygon border values are random):
I investigated your problem but I’m not able to reproduce it. I saw that the example is from upper left corner of the bounding box of the dataset ./data/train/train.shp from the GitHub repository. I ran the rasterization and there were no issues on the borders.
Is it possible that the way you plot the rasterized array produces errors and that the array itself is ok?
If this isn’t the case, then please provide more information that would allow us to fully reproduce the problem:
Yes, I reduced my AOI to only the top left portion of the original dataset. Although, I have also tried with other parts of the original shapefile and get similar outcomes. I haven’t been able to try the entire dataset as it it quite large for the current tests I am doing.
Thanks for providing more info. I can now confirm that the problem is in the plotting code and not in the rasterization process. An easy way to see this is to check unique values in the array you are plotting:
import numpy as np

np.unique(eopatch.mask_timeless['lulc_eroded'])
For your example above it should return only values array([0, 6, 8], dtype=uint8). Hence any other values were made up by matplotlib which is by default using interpolation for plotting. Therefore you can fix this by disabling the interpolation:
im = ax.imshow(
    eopatch.mask_timeless['lulc_eroded'].squeeze(),
    cmap=lulc_cmap,
    norm=lulc_norm,
    interpolation='none'
)