Hello everybody,
I would like your help to display the eopatches individually from the reference map to the prediction level as shown below.
Thank you,
Cordially
Hello,
Could you please clarify your question a little? It is quite vague and hard to understand what you are exactly trying to achieve: maybe if you share your workflow and where you are stuck it would help to provide some guidance.
Thanks,
Hello Max,
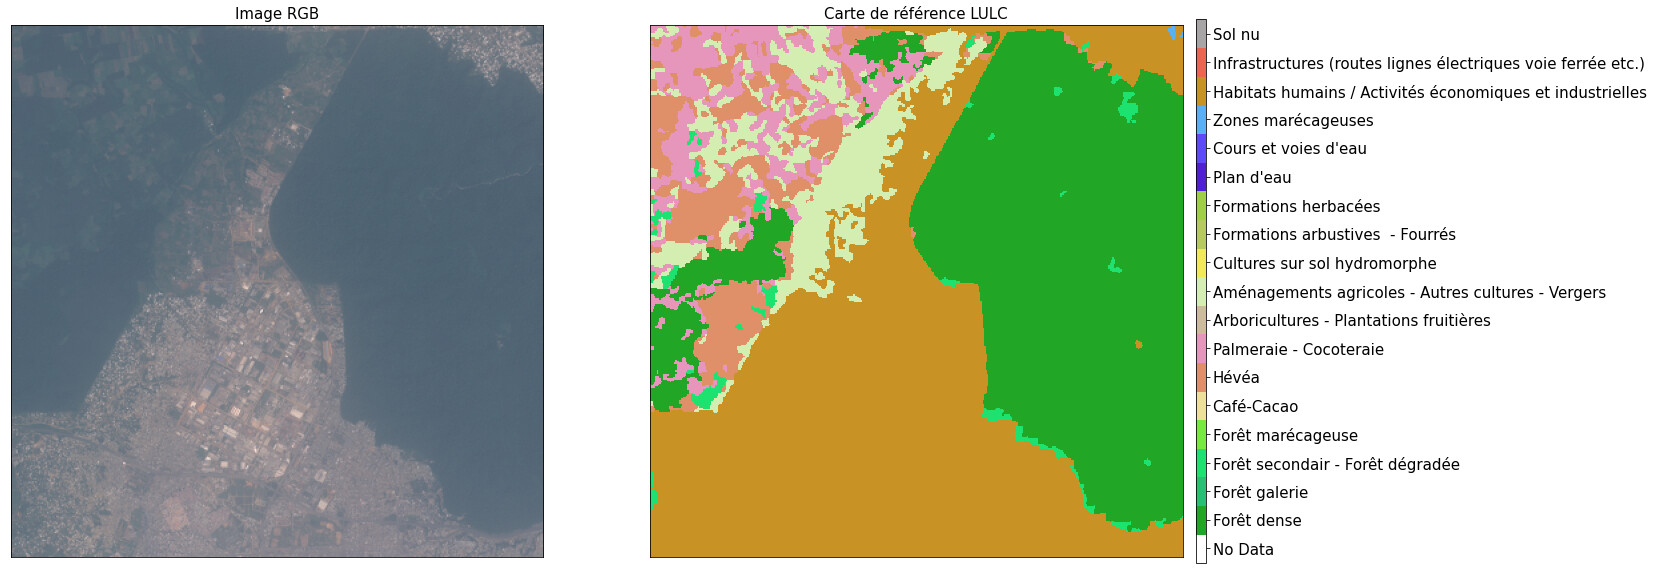
Thank you, the problem is that the image in the post is an image that allowed me to view the real image and the classification deduced on a reference map composed of 25 epatches. I would like to do the same at the level of training or at the level of the prediction card. Here is the code used to visualize the code at the eopatch level.
# Chargement et visualisation de la carte de reference de l'eopache 17
# Loading and visualization of the eopache 17 reference map
eopatch_17 = EOPatch.load(os.path.join(EOPATCH_FOLDER, 'eopatch_17'), lazy_loading=True)

# Plot
fig, (ax1, ax2) = plt.subplots(1,2,figsize=(25,10))

_ = ax1.imshow(np.clip(eopatch_17.data['BANDS'][0][..., [3,2,1]] * 3.5, 0., 1.))
ref_map = ax2.imshow(eopatch_17.mask_timeless['LULC'][...,0], interpolation='nearest', cmap=lulc_cmap, norm=lulc_norm)

ax1.set_xticks([])
ax1.set_yticks([])
ax2.set_xticks([])
ax2.set_yticks([])
ax1.set_title('Image RGB', fontsize=15)
ax2.set_title('Carte de référence LULC', fontsize=15)

cb = fig.colorbar(ref_map, ax=[ax1, ax2], orientation='vertical', pad=0.01, aspect=60)
cb.set_ticks([entry.id for entry in LULC])
cb.ax.set_yticklabels([entry.class_name for entry in LULC], fontsize=15);
Thank you ![]()
Just to make sure I understand correctly (sorry if I don’t get it): you would like to plot all 25 patches at the same time?
This topic was automatically closed 60 days after the last reply. New replies are no longer allowed.