Hi,
I have purchased a pleiades image. I can visualize it using EO browser, however , visualizing it with python doesn’t work.
I have followed this tutorial in order to visualize the image.
this is what I did:
# Initialize SentinelHubBYOC class

byoc = SentinelHubBYOC(config=config)

#airbus plaiedas

my_collection = byoc.get_collection('THIS_IS_SECRET')

print(f"name: {my_collection['name']}")

print(f"id: {my_collection['id']}")

#get list of tiles inside the collection
tiles = list(byoc.iter_tiles(my_collection))

#convert it to ByocTile dataclass

tile = ByocTile.from_dict(next(byoc.iter_tiles(my_collection)))

#visualized tiles

tile_iterator = byoc.iter_tiles(my_collection)

tiles_for_visualized = []

#should be for in in range(#number of images)

for i in [0]:

    tiles_for_visualized.append(ByocTile.from_dict(next(tile_iterator)))

tiles_gdf = gpd.GeoDataFrame(

    tiles_for_visualized,

    geometry=[t.cover_geometry.transform(CRS.WGS84).geometry for t in tiles_for_visualized],

    crs="epsg:4326",)

tiles_gdf.head()

data_collection = DataCollection.define_byoc(my_collection["id"])

#######THIS PART DOESN'T WORK#########
tile_time = dt.datetime.fromisoformat(tiles[0]["sensingTime"])
ValueError: Invalid isoformat string: ‘2022-09-25T19:08:28.500Z’
I have tried to skip this by manually insert the date ‘2022-09-25’ and send the request but that yield an empty image:
bbox_size,bbox,bbox_coords_wgs84=get_bbox_from_shape(tiles_gdf,0.5)
evalscript = """

//VERSION=3

function setup() {

  return {

    input: ["B3","B2","B1", "B0"],

    output: { bands: 4 },

  };

}

function evaluatePixel(sample) {

  return [sample.B0, sample.B1,sample.B2,sample.B3];

}

"""

request = SentinelHubRequest(

    evalscript=evalscript,

    input_data=[SentinelHubRequest.input_data(data_collection=data_collection, time_interval='2022-09-25')],

    responses=[SentinelHubRequest.output_response("default", MimeType.TIFF)],

    bbox=bbox,

    size=bbox_size,

    config=config,

)
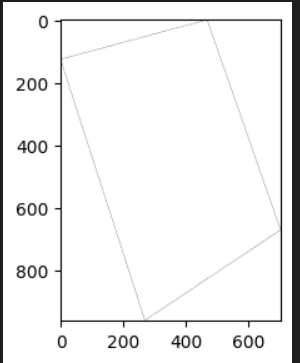
That gives me an image with the borders of the polygon of the image but no values:
My questions are:
- I think there is problem with the tutorial with the date format shown there, seems like it works with the format I inserted manually?
- How can I visualize my image? what is wrong with my script?
Thanks in advance ![]()