Visualize radar image Eolearn

hello everyone
I’m trying to execute the same example of slovenia but now with sentinel 1A data .
I try this configuration as you tell me :

s1_evalscript = """
//VERSION=3
function setup() {
  return {
    input: [{
        bands:["VV", "VH", "dataMask"], 
        metadata: ["bounds"]
    }],
    output: [
      {
          id: "VV",
          bands: 1,
          sampleType: "FLOAT32",
          nodataValue: NaN,
      },
      {
          id: "VH",
          bands: 1,
          sampleType: "FLOAT32",
          nodataValue: NaN,
      },
      {
          id: "MASK",
          bands: 1,
          sampleType: "UINT8",
          nodataValue: 0,
      }
    ]
  };
}

    function evaluatePixel(samples) {
      return {
        VV: [samples.VV],
        VH: [samples.VH],
        MASK: [samples.dataMask]
      };
    }
    """

s1_processing = {
    "backCoeff": "GAMMA0_TERRAIN",
    "orthorectify": True,
    "demInstance": "COPERNICUS_30",
}

s1_input = SentinelHubEvalscriptTask(
    features={
        FeatureType.DATA: {'VV', 'VH'},
        FeatureType.MASK: {'MASK'}
    },
    evalscript=s1_evalscript,
    data_collection=DataCollection.SENTINEL1,
    resolution=10,
    time_difference=datetime.timedelta(minutes=120),
    aux_request_args={'processing': s1_processing},
    max_threads=5,
)
`

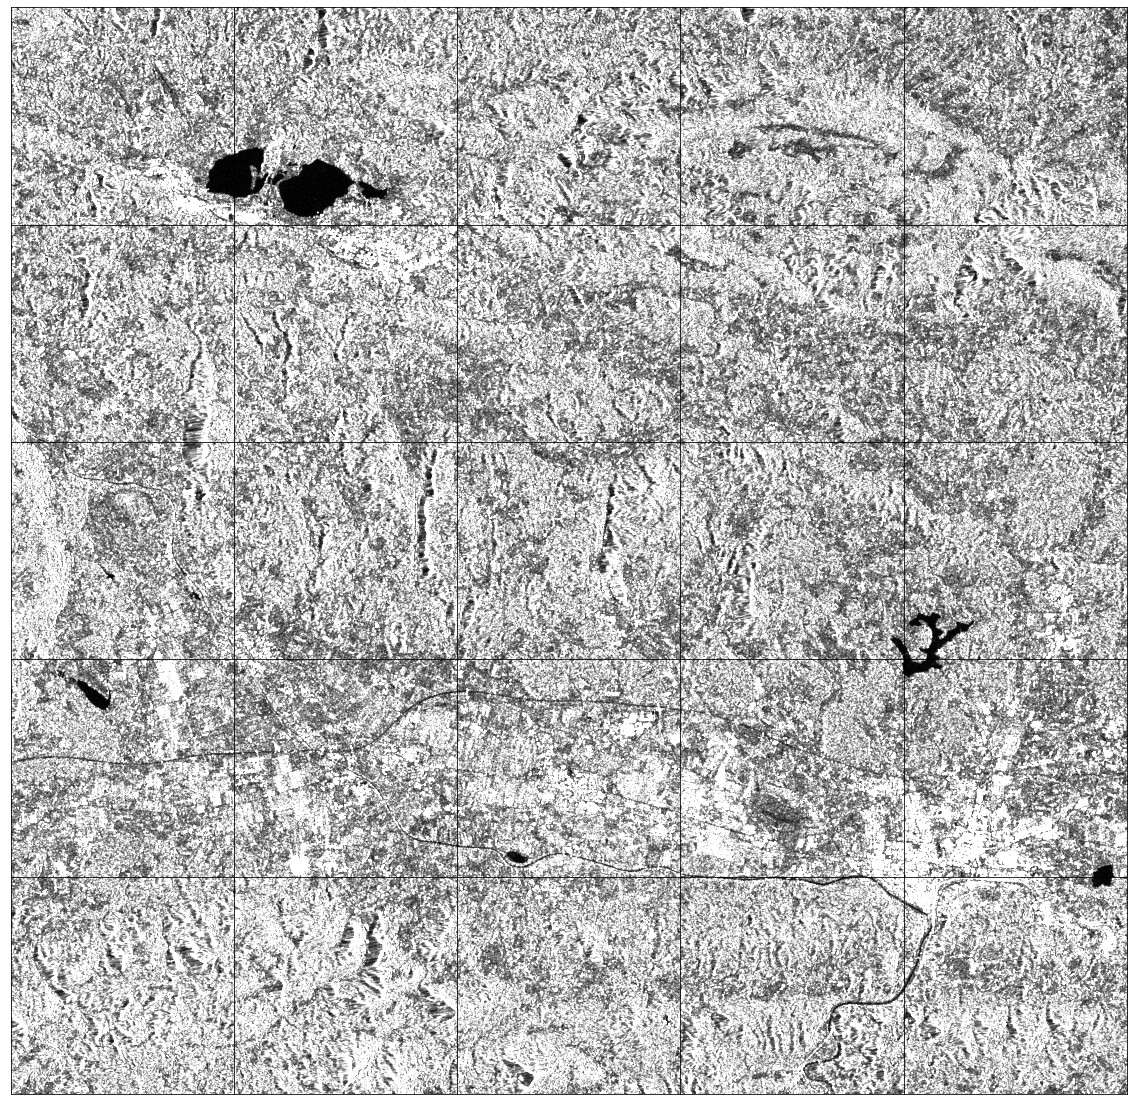
Now after the download of images , I would like to visualize an image in the exact date .
In slovenia’s case we have these line of code :

fig, axs = plt.subplots(nrows=5, ncols=5, figsize=(20, 20))
date = datetime.datetime(2019, 7, 1, tzinfo=dateutil.tz.tzutc())

for i in tqdm(range(len(patchIDs))):
    eopatch_path = os.path.join(EOPATCH_FOLDER, f'eopatch_{i}')
    eopatch = EOPatch.load(eopatch_path, lazy_loading=True)
    dates = np.array(eopatch.timestamp)
    closest_date_id = np.argsort(abs(date-dates))[0]

    ax = axs[i//5][i%5]
    ax.imshow(np.clip(eopatch.data['BANDS'][closest_date_id][..., [2, 1, 0]] * 3.5, 0, 1))
    ax.set_xticks([])
    ax.set_yticks([])
    ax.set_aspect("auto")
    del eopatch

fig.subplots_adjust(wspace=0, hspace=0)

So how can I do to adapt this code to my example and visualize the radar image?
Any help please ! :pensive:

Hi @Maryem,

What did you try? If you look at the structure of your new eopatches containing S1 data you should be able to spot the differences with the S2 patches and adapt the code.

To read the structure of a patch, you can print the eopatch:

# Set the path containing your patches
path_out = './eopatches'
 
# Load patch 1 for example
eopatch = EOPatch.load(f'{path_out}/eopatch_1', lazy_loading=True)

# Print the contents to see the structure
print(eopatch)

Based on the contents you can then access the data. Below is an example for VV (I commented each line so that you understand the code and then can adapt it yourself to suit your needs):

path_out = './eopatches'
fig, axs = plt.subplots(nrows=5, ncols=5, figsize=(20, 20))

# Here I pick a date within the time range, choose the date you are interested in
date = datetime.datetime(2019,11,25)

# Loop over the patches of interest
for i in tqdm(range(len(patchIDs))):
    
    # Load the patch
    eopatch = EOPatch.load(f'{path_out}/eopatch_{i}', lazy_loading=True)
    
    ax = axs[i//5][i%5]
    
    # Calculate the closest date to the one set above
    dates = np.array([x.replace(tzinfo=None) for x in eopatch.timestamp])
    closest_date_id = np.argsort(abs(date-dates))[0]
    
    # Plot VV for the closest date in Grey scale
    ax.imshow(eopatch.data['VV'][closest_date_id], cmap="Greys_r", vmin=0, vmax=0.25)
    
    # Adjust the plot
    ax.set_xticks([])
    ax.set_yticks([])
    ax.set_aspect("auto")
    del eopatch

fig.subplots_adjust(wspace=0, hspace=0)

The above should get you the image below:

1 Like

Thank you so much I get successfully the image . :rose:
Now can you help me in the extraction of
rebroadcasting coefficient in the booth bands VV and VH from every eopatch ?
I think that I must set the output of s1_input but I don’t know how do that :pensive:

Great that it works for you! :fireworks:

For the next part, I would suggest that you give it a try and see if you can get to the results yourself. If you get stuck somewhere specific, then it will be much easier for us to help.

Hello @maxim.lamare
I hope to solve this problem by myself but honestly this task seems very complicated for me and I am stuck in this step!
After a search I find the formula which returns the value of the backscattering coefficient at the level of the VV band Math.max(0, Math.log((sample.VV)) * 0.21714724095 + 1) .
But I do not know how I will integrate it into an eotask like the NDVI calculation case for the optical image.
Could you please help me?

With this information, we can move forward. :sunglasses:

So, you are looking to return the backscatter coefficient for VV. The formula that you are referring to in your post is used to visualise the data only: the values have no physical sense. See this forum post and this one from a while back.

This means that if we take your example in your first post, we can modify it as follows. Pay attention to the type of backscatter coefficient you want to return. There is some good information about the coefficients on the step forum, its worth a read! For the example here, let’s just go with the default GAMMA0_ELLIPSOID. We will return the backscatter coefficient in decibels.

s1_evalscript = """
//VERSION=3
function setup() {
  return {
    input: [{
        bands:["VV", "dataMask"], 
        metadata: ["bounds"]
    }],
    output: [
      {
          id: "VV",
          bands: 1,
          sampleType: "FLOAT32",
          nodataValue: NaN,
      },
      {
          id: "MASK",
          bands: 1,
          sampleType: "UINT8",
          nodataValue: 0,
      }
    ]
  };
}

    function evaluatePixel(samples) {
      var VV_log = 10 * Math.log(samples.VV) / Math.LN10;
      return {
        VV: [VV_log],
        MASK: [samples.dataMask]
      };
    }
    """

s1_processing = {
    "backCoeff": "GAMMA0_ELLIPSOID",
    "orthorectify": True,
    "demInstance": "COPERNICUS_30",
}

s1_input = SentinelHubEvalscriptTask(
    features={
        FeatureType.DATA: {'VV'},
        FeatureType.MASK: {'MASK'}
    },
    evalscript=s1_evalscript,
    data_collection=DataCollection.SENTINEL1,
    resolution=10,
    time_difference=datetime.timedelta(minutes=120),
    aux_request_args={'processing': s1_processing},
    max_threads=5,
)

As you can see, you can manipulate the data you want to return using the Evalscript, without changing your existing workflow that much.

Hi @maxim.lamare
One last question about this topic please !
Now I have the image with backscatter coefficient extraction.
I have successfuly visualize my image.


The last task here, and I’ll be very happy if I get a response from you, is to check if the returned backscatter coefficient values are correct or not .
I want to extract the data from this image into an array.
My table must contain three columns (lang, lat, backscatter coefficient).
Thanks in advance!

I can point you towards a solution (there may be other ways to approach this), but I cannot write it for you.

To get your data in a table, you are going to have to calculate the longitude and latitude of your pixels and store them in 2 new arrays of the size of your bands. All the infos are available for your patch if you print the metadata. E.g.:

path_out = './eopatches'
    
eopatch = EOPatch.load(f'{path_out}/eopatch_1', lazy_loading=True)

print(eopatch)

As you can see, you have the Bbox information and the size of the array. I would use gdal to compute arrays of latitude and longitude.

Once you have your latitude and longitude arrays, you can pass them as columns to a pandas dataframe. You can then do the same with your VV band (or whatever band you are interested in). It would look something like this:

import pandas as pd

df = pd.DataFrame()

df['lat'] = pd.Series(latitude.flatten())
df['lon'] = pd.Series(longitude.flatten())

# For time step 5 in this example
df['VV'] = pd.Series(eopatch.data["VV"][5,:,:,0].flatten())

This is just an example of how I would approach the problem, if someone else has a better solution, please chime in!

Furthermore, if you develop a nice solution, it would be great to share with other users in this thread!

Hi @maxim.lamare
Thank you very much for your help !
Be sure that when I finish my solution , I will share it with others !

1 Like