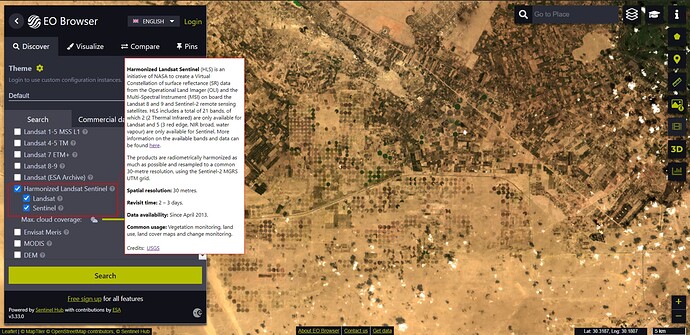
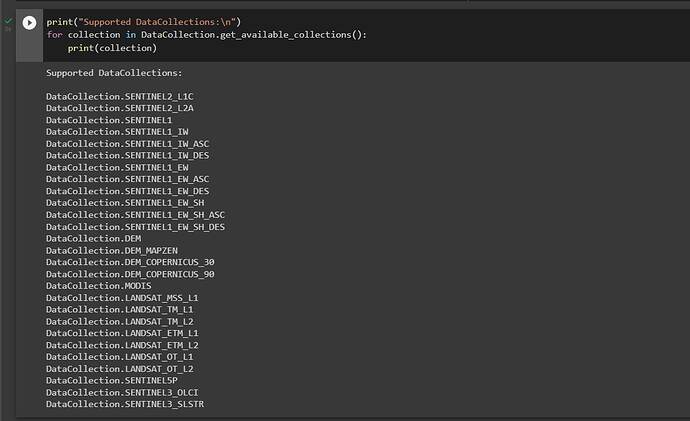
We’ll add the collection to sentinelhub-py in the next days. In the mean time, you can have a look at the attached notebook how one can define the data collection by themselves:
from sentinelhub import DataCollection, Band, Unit, MosaickingOrder, to_utm_bbox

optical_bands = tuple(
    Band(name, (Unit.REFLECTANCE, Unit.DN), (np.int16))
    for name in ["CoastalAerosol", "Blue", "Green", "Red", "RedEdge1", "RedEdge2",
                 "RedEdge3", "NIR_Broad", "NIR_Narrow", "SWIR1", "SWIR2", "WaterVapor", "Cirrus"]
)

termal_bands = tuple(
    Band(name, (Unit.BRIGHTNESS_TEMPERATURE, Unit.DN), (np.int16))
    for name in ["ThermalInfrared1", "ThermalInfrared2"]
)

QA_band = Band("QA", (Unit.DN), (np.uint8)),
angles = tuple(
    Band(name, (Unit.DEGREES, Unit.DN), (np.uint16))
    for name in ["VAA", "VZA", "SAA", "SZA"]
)

bands = optical_bands + termal_bands + QA_band + angles

hsl_collection = DataCollection.define(
    name="Harmonized LandSat Sentinel",
    api_id="hls",
    catalog_id="hls",
    collection_type="HLS",
    service_url="https://services-uswest2.sentinel-hub.com",
    bands=bands
)
Afterwards, you can use it as any other data collection on Sentinel Hub:
hsl_evalscript = """
//VERSION=3
function setup() {
  return {
    input: ["Blue","Green","Red", "dataMask"],
    output: { bands: 4 }
  };
}

function evaluatePixel(sample) {
  return [sample.Blue, sample.Green, sample.Red, sample.dataMask];
}
"""

request = SentinelHubRequest(
    evalscript=hsl_evalscript,
    input_data=[SentinelHubRequest.input_data(
        data_collection=hsl_collection,
        time_interval=("2022-01-11","2022-08-11"),
        maxcc=0.3,
        mosaicking_order=MosaickingOrder.LEAST_CC
    )],
    responses=[SentinelHubRequest.output_response("default",MimeType.TIFF)],
    bbox=bbox,
    resolution=(10,10)
)

response = request.get_data()[0]
Good luck!


