Same NDVI values for different and widely separated time range

i am using sentenel-2-l2a to get ndvi values for a given polygon geometry in epsg3857
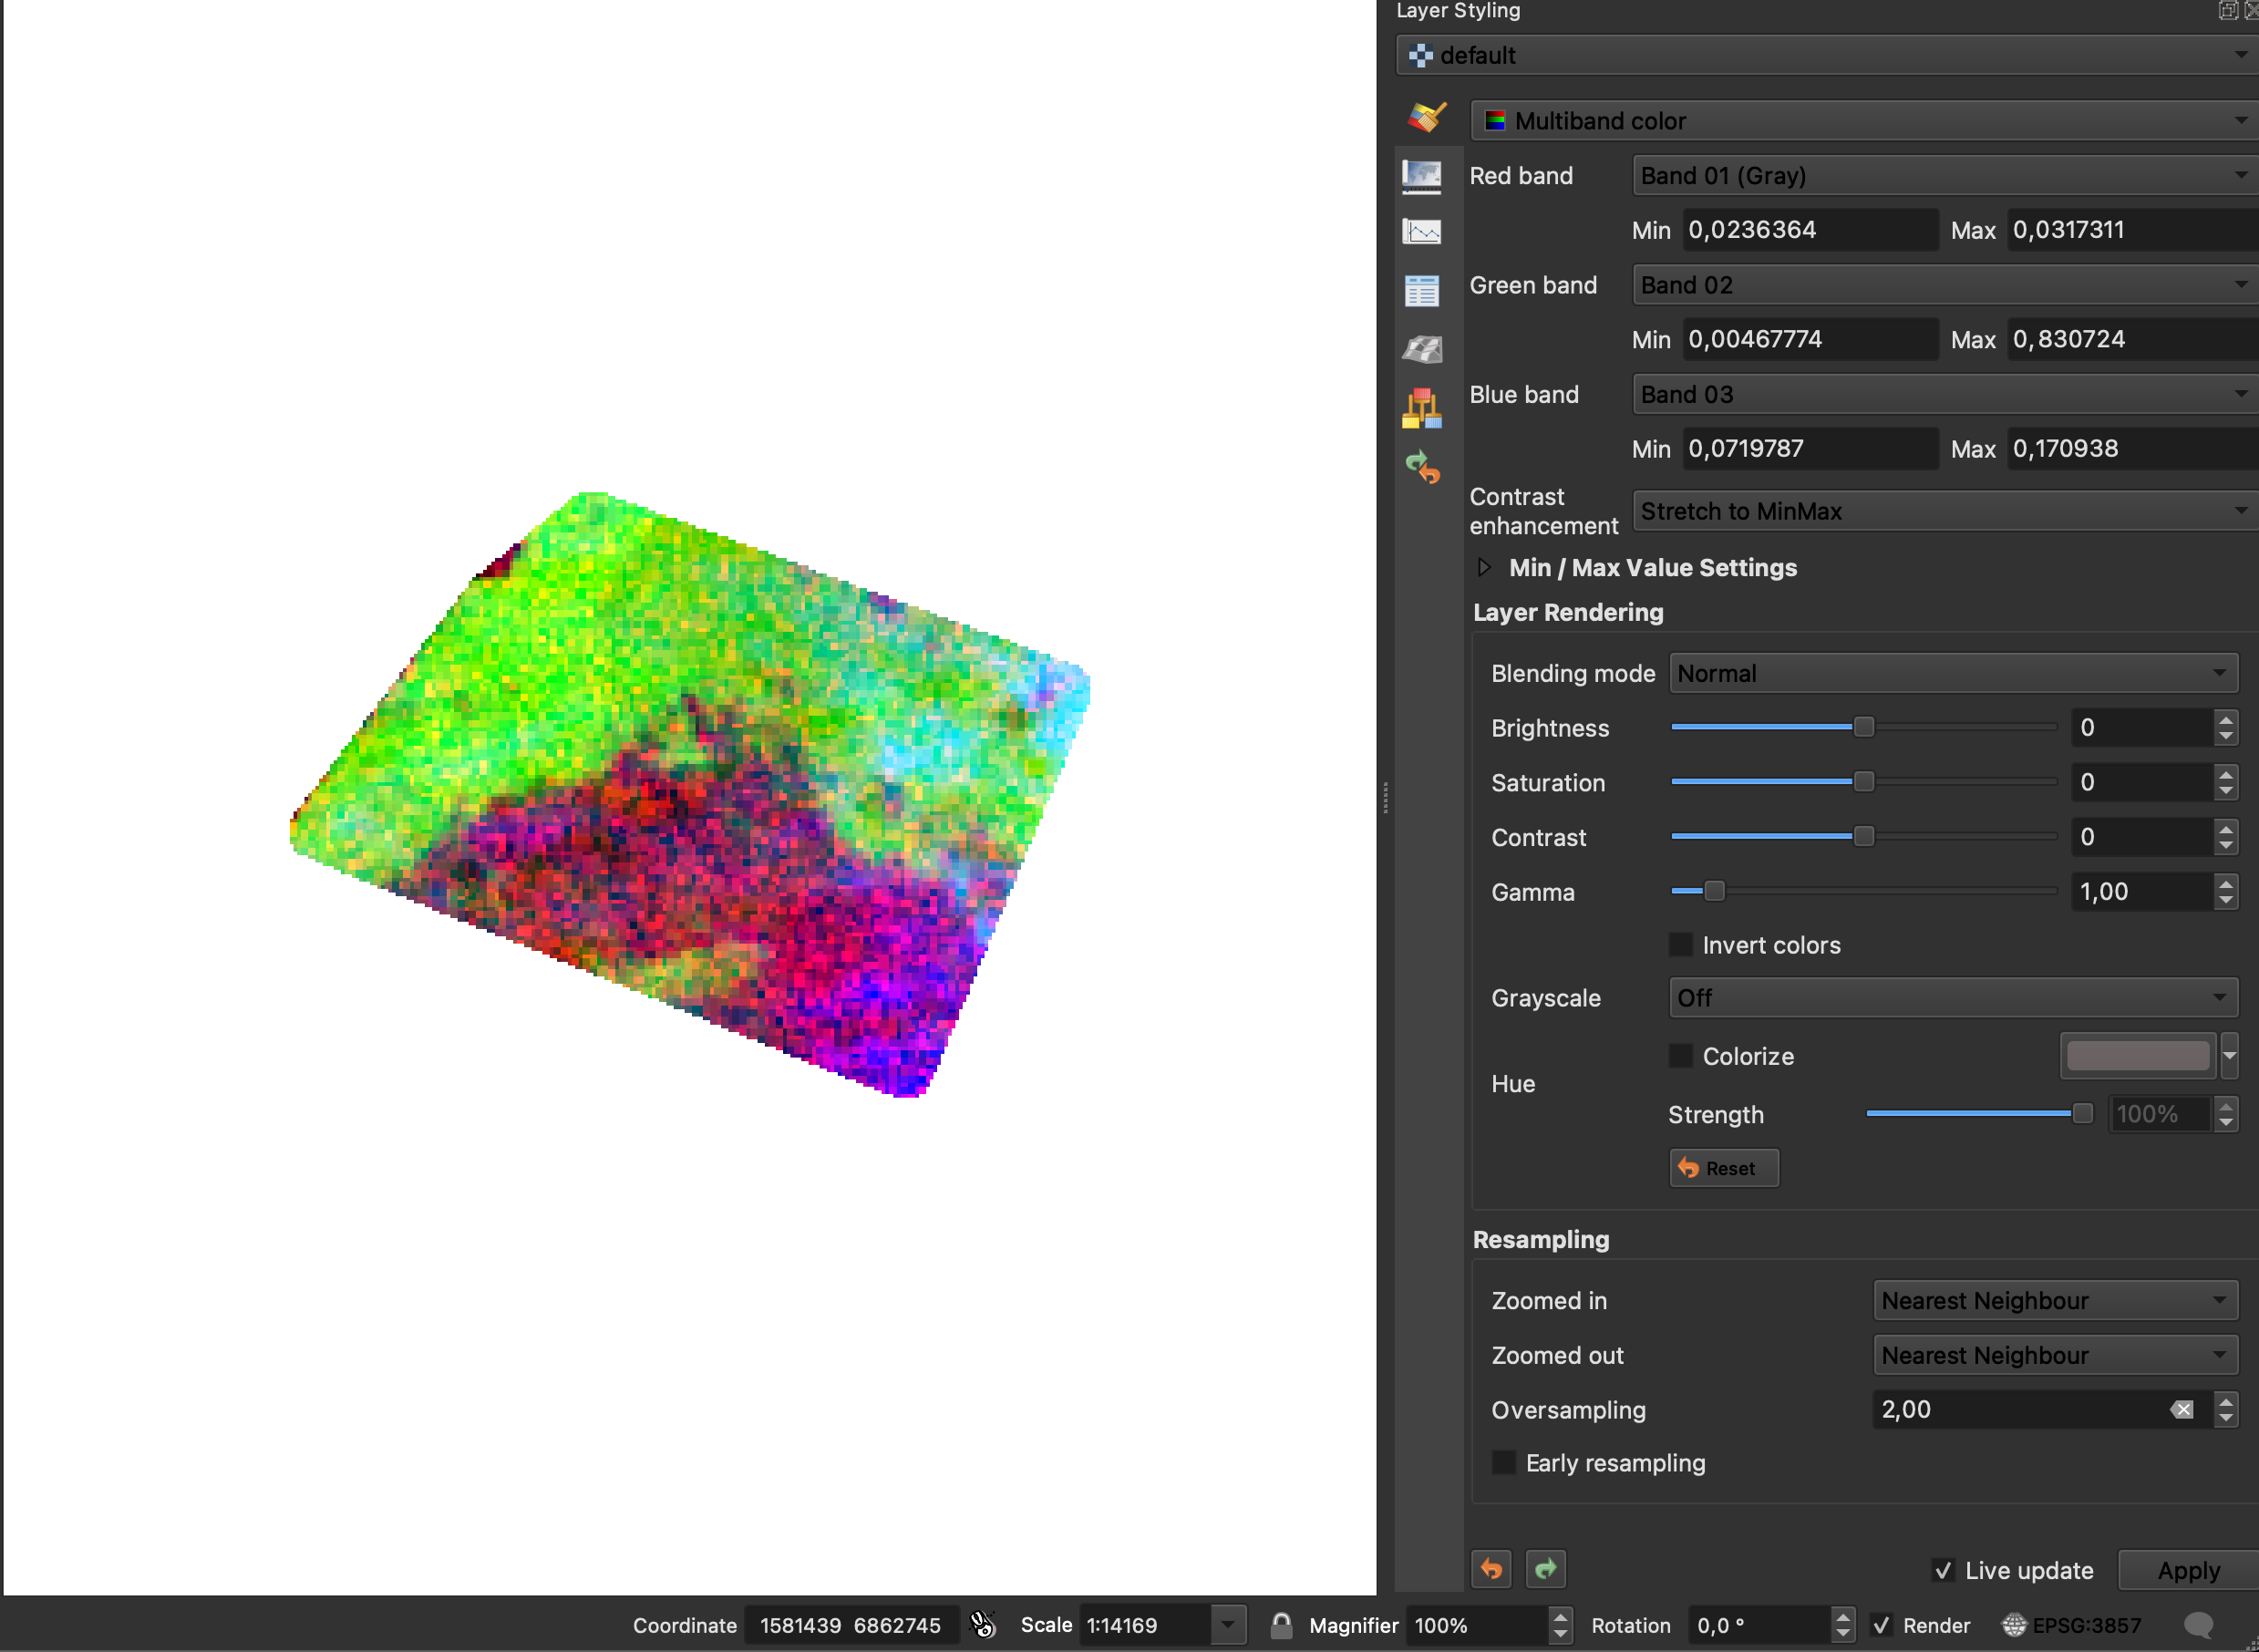
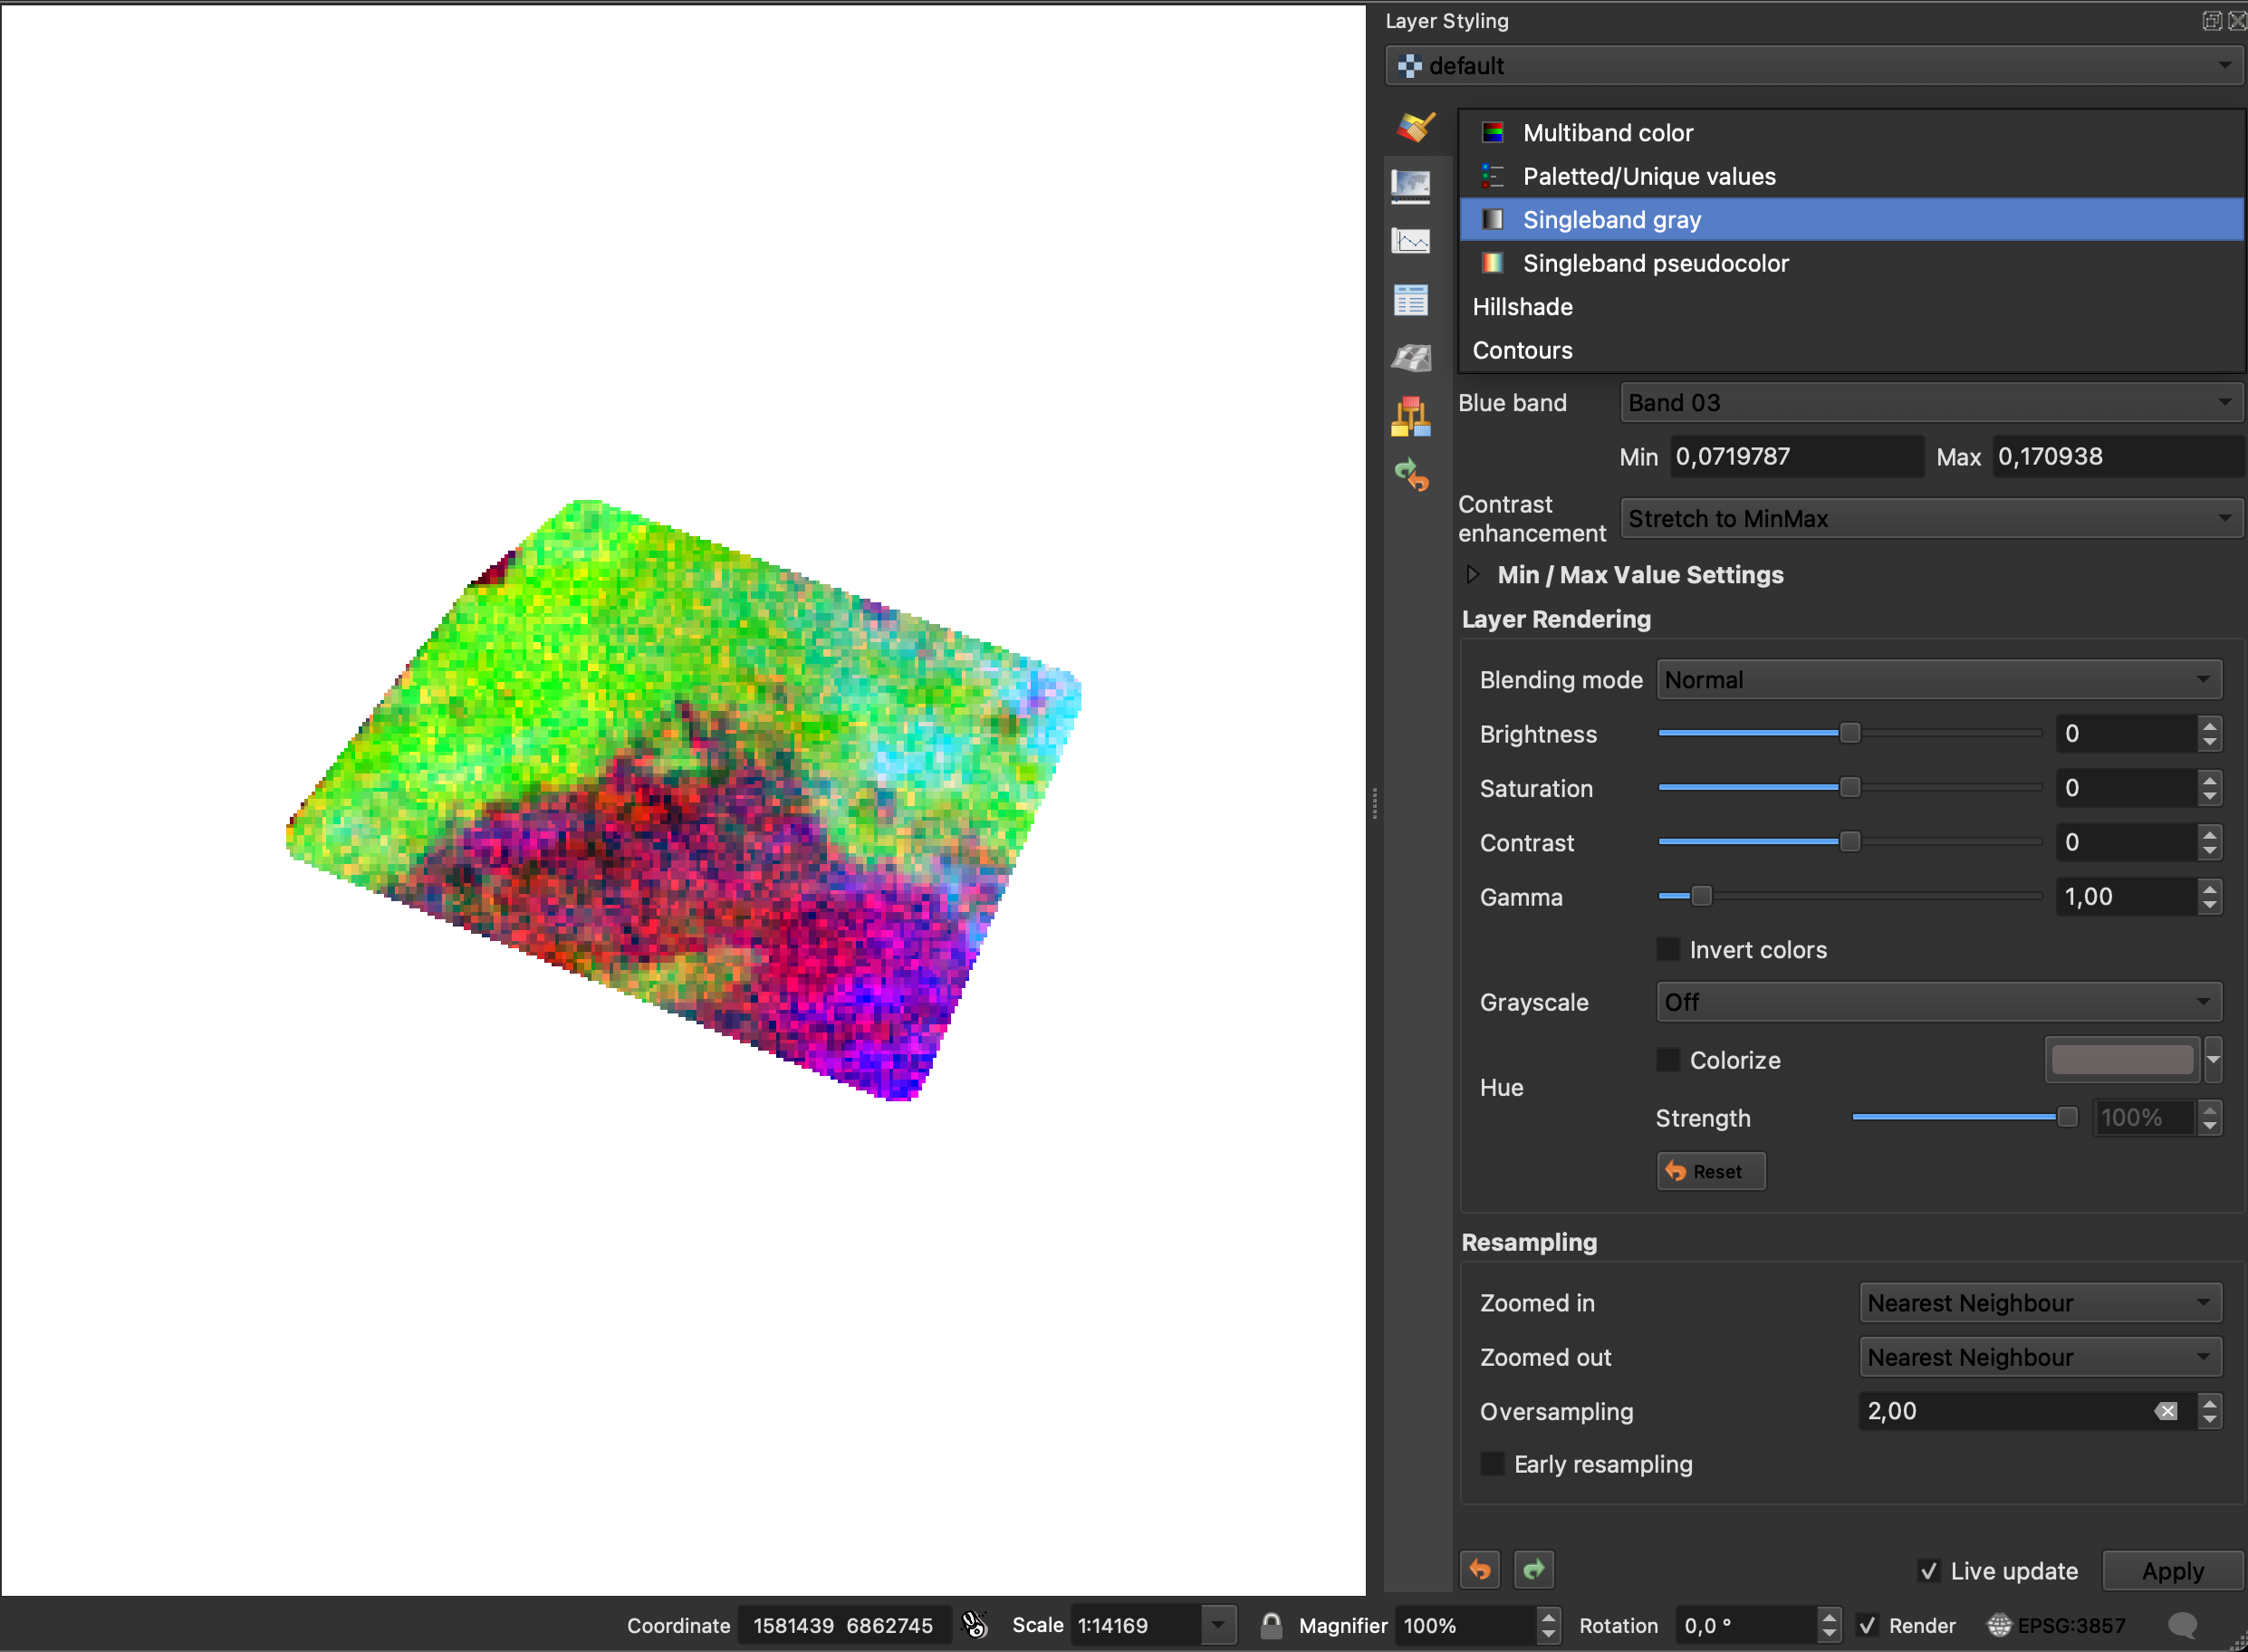
despite i set different time ranges, however the tiff files i am getting contain the same ndvi values. i investigated their contents in qgis

please have a look at the request and the evaluation script used and let me know why i am getting the same ndvi vlaues for widly spearated time ranges
the request i am using is:

curl -X POST https://services.sentinel-hub.com/api/v1/process \
 -H 'Content-Type: application/json' \
 -H 'Authorization: Bearer '' \
 -H 'Accept: application/tar' \
 -d '{
  "input": {
    "bounds": {
      "geometry": {
        "type": "Polygon",
        "coordinates": [
          [
            [
              1579250.82367497,
              6861560.75494123
            ],
            [
              1579262.05009723,
              6861568.0993758
            ],
            [
              1579274.53666044,
              6861572.98902966
            ],
            [
              1579287.75641312,
              6861575.2175475
            ],
            [
              1579301.15146001,
              6861574.6908805
            ],
            [
              1579314.15650793,
              6861571.431256
            ],
            [
              1580614.32240361,
              6861098.63910992
            ],
            [
              1580626.20934827,
              6861092.89222752
            ],
            [
              1580636.69971985,
              6861084.86506323
            ],
            [
              1580645.36441237,
              6861074.88597658
            ],
            [
              1580651.8490035,
              6861063.36316948
            ],
            [
              1580655.88825164,
              6861050.76798707
            ],
            [
              1580657.31694429,
              6861037.61563564
            ],
            [
              1580656.07665425,
              6861024.44410741
            ],
            [
              1580652.2181275,
              6861011.79217384
            ],
            [
              1580213.19772315,
              6859964.91889461
            ],
            [
              1580207.16807032,
              6859953.72991754
            ],
            [
              1580199.09260609,
              6859943.92221921
            ],
            [
              1580189.27663079,
              6859935.86657521
            ],
            [
              1580178.09124157,
              6859929.86752367
            ],
            [
              1580165.95930318,
              6859926.15185373
            ],
            [
              1580153.33946234,
              6859924.86003288
            ],
            [
              1580140.70880969,
              6859926.0408975
            ],
            [
              1580128.5448448,
              6859929.64980675
            ],
            [
              1578507.57893836,
              6860588.16085359
            ],
            [
              1578495.82259782,
              6860594.40233978
            ],
            [
              1578485.57332546,
              6860602.90455025
            ],
            [
              1578477.25717289,
              6860613.31406842
            ],
            [
              1578471.21983892,
              6860625.19819229
            ],
            [
              1578467.71229861,
              6860638.06291925
            ],
            [
              1578466.88036911,
              6860651.37347985
            ],
            [
              1578468.75864619,
              6860664.57656646
            ],
            [
              1578473.26906401,
              6860677.12333377
            ],
            [
              1578480.22413819,
              6860688.49221449
            ],
            [
              1578750.38594929,
              6861043.08417387
            ],
            [
              1578750.45489957,
              6861043.17450606
            ],
            [
              1578969.96138274,
              6861330.22514622
            ],
            [
              1578980.66035828,
              6861341.24507847
            ],
            [
              1579250.82367497,
              6861560.75494123
            ]
          ]
        ]
      },
      "properties": {
        "crs": "http://www.opengis.net/def/crs/EPSG/0/3857"
      }
    },
    "data": [
      {
        "dataFilter": {
          "timeRange": {
            "from": "2000-07-12T00:00:00Z",
            "to": "2023-08-07T23:59:59Z"
          }
        },
        "type": "sentinel-2-l2a"
      }
    ]
  },
  "output": {
    "width": 512,
    "height": 276.639,
    "responses": [
      {
        "identifier": "default",
        "format": {
          "type": "image/tiff"
        }
      }
    ]
  },
  "evalscript": "//VERSION=3\n            function setup() {\n            return{\n                input: [{\n                bands: [\"B04\", \"B08\"],\n                units: \"DN\"\n                }],\n                output: {\n                id: \"default\",\n                bands: 1,\n                sampleType: SampleType.FLOAT32\n                }\n            }\n            }\n\n            function evaluatePixel(sample) {\n            let ndvi = (sample.B08 - sample.B04) / (sample.B08 + sample.B04)\n            return [ ndvi ]\n            }"
}'

the evaluation script i am using is as follows:

def evalscriptNDVIValuesInGeoTIFF():
    return """
        //VERSION=3
        function setup() {
        return{
            input: [{
            bands: ["B04", "B08"],
            units: "DN"
            }],
            output: {
            id: "default",
            bands: 1,
            sampleType: SampleType.FLOAT32
            }
        }
        }

        function evaluatePixel(sample) {
        let ndvi = (sample.B08 - sample.B04) / (sample.B08 + sample.B04)
        return [ ndvi ]
        }
    """

Hi @sentinelhub19 ,

Could you please also provide us the other request with a different time range which returned the same NDVI values? Thank you.

Please check
“timeRange”: {
“from”: “2000-07-12T00:00:00Z”,
“to”: “2023-08-07T23:59:59Z”
}
And just change the ‘from’ value to, for example, “timeRange”: {
“from”: “2023-07-12T00:00:00Z”,
“to”: “2023-08-07T23:59:59Z”
}

Is it clearer now?
Thanks

Hi @sentinelhub19 ,

This is clear now. The reason behind this is that by default the mosaicking is SIMPLE and the mosaickingOrder is mostRecent, meaning that the API will return the imagery mosaicked with the most recent acquisition over your AOI.

If you’re interested in getting a NDVI time series, please refer to the NDVI time series script.

@chung.horng Would you please tell me how did you know that I was using ‘mosaicking’ with most recent values?i mean, which part of the request I posted in the question indicates that ?
Would you please provide an example?

Hi @sentinelhub19 ,

The curl request you provided contains all the information about your request. Please refer to the API reference for the request body schema.

Since mosaickingOrder is not specified in the request body, it is using the default option mostRecent. Also, mosaicking is not specified in your Evalscript so the default option SIMPLE is used in this case.

@chung.horng thank you very much

@chung.horng as stated in the link you provided for the time series script, should I just copy and paste the evaluation-script and modify the ‘responses’ object accordingly please

@sentinelhub19 I just noticed an error in the response (we will fix it later). Please copy and paste the following responses to your request body:

"reponses": [
    {
        "identifier": "default",
        "format": {
            "type": "image/tiff"
        }
    },
    {
        "identifier": "userdata",
        "format": {
            "type": "application/json"
        }
    }
]

@chung.horng good morning,
actually, i tried the script you provided in this link i also used the responses parameter/object as you stated in your last reply message. i tried it in the request_builder, but the tiff files i am getting still contains the same ndvi values.
i changed the from date but the tiff files i am getting are identical.

would you please help me fix it and solve it

Note:
when i copy and pasted the script mentioned below in the request-builder, the ‘“evalscript”:’ parameter gets automatically changed to be as follows

eval-script in request-builder

"evalscript": "//VERSION=3\n            function setup() {\n            return{\n                input: [{\n                bands: [\"B04\", \"B08\"],\n                units: \"DN\"\n                }],\n                output: {\n                id: \"default\",\n                bands: 1,\n                sampleType: SampleType.FLOAT32\n                }\n            }\n            }\n\n            function evaluatePixel(sample) {\n            let ndvi = (sample.B08 - sample.B04) / (sample.B08 + sample.B04)\n            return [ ndvi ]\n            }"

my request:

 curl -X POST https://services.sentinel-hub.com/api/v1/process \
 -H 'Content-Type: application/json' \
 -H 'Authorization: Bearer xxx' \
 -H 'Accept: application/tar' \
 -d '{
  "input": {
    "bounds": {
      "geometry": {
        "type": "Polygon",
        "coordinates": [
          [
            [
              1579250.82367497,
              6861560.75494123
            ],
            [
              1579262.05009723,
              6861568.0993758
            ],
            [
              1579274.53666044,
              6861572.98902966
            ],
            [
              1579287.75641312,
              6861575.2175475
            ],
            [
              1579301.15146001,
              6861574.6908805
            ],
            [
              1579314.15650793,
              6861571.431256
            ],
            [
              1580614.32240361,
              6861098.63910992
            ],
            [
              1580626.20934827,
              6861092.89222752
            ],
            [
              1580636.69971985,
              6861084.86506323
            ],
            [
              1580645.36441237,
              6861074.88597658
            ],
            [
              1580651.8490035,
              6861063.36316948
            ],
            [
              1580655.88825164,
              6861050.76798707
            ],
            [
              1580657.31694429,
              6861037.61563564
            ],
            [
              1580656.07665425,
              6861024.44410741
            ],
            [
              1580652.2181275,
              6861011.79217384
            ],
            [
              1580213.19772315,
              6859964.91889461
            ],
            [
              1580207.16807032,
              6859953.72991754
            ],
            [
              1580199.09260609,
              6859943.92221921
            ],
            [
              1580189.27663079,
              6859935.86657521
            ],
            [
              1580178.09124157,
              6859929.86752367
            ],
            [
              1580165.95930318,
              6859926.15185373
            ],
            [
              1580153.33946234,
              6859924.86003288
            ],
            [
              1580140.70880969,
              6859926.0408975
            ],
            [
              1580128.5448448,
              6859929.64980675
            ],
            [
              1578507.57893836,
              6860588.16085359
            ],
            [
              1578495.82259782,
              6860594.40233978
            ],
            [
              1578485.57332546,
              6860602.90455025
            ],
            [
              1578477.25717289,
              6860613.31406842
            ],
            [
              1578471.21983892,
              6860625.19819229
            ],
            [
              1578467.71229861,
              6860638.06291925
            ],
            [
              1578466.88036911,
              6860651.37347985
            ],
            [
              1578468.75864619,
              6860664.57656646
            ],
            [
              1578473.26906401,
              6860677.12333377
            ],
            [
              1578480.22413819,
              6860688.49221449
            ],
            [
              1578750.38594929,
              6861043.08417387
            ],
            [
              1578750.45489957,
              6861043.17450606
            ],
            [
              1578969.96138274,
              6861330.22514622
            ],
            [
              1578980.66035828,
              6861341.24507847
            ],
            [
              1579250.82367497,
              6861560.75494123
            ]
          ]
        ]
      },
      "properties": {
        "crs": "http://www.opengis.net/def/crs/EPSG/0/3857"
      }
    },
    "data": [
      {
        "dataFilter": {
          "timeRange": {
            "from": "2000-07-12T00:00:00Z",
            "to": "2023-08-07T23:59:59Z"
          }
        },
        "type": "sentinel-2-l2a"
      }
    ]
  },
  "output": {
    "width": 512,
    "height": 276.639,
    "responses": [
      {
        "identifier": "default",
        "format": {
          "type": "image/tiff"
        }
      },
      {
        "identifier": "userdata",
        "format": {
          "type": "application/json"
        }
      }
    ]
  },
  "evalscript": "//VERSION=3\n            function setup() {\n            return{\n                input: [{\n                bands: [\"B04\", \"B08\"],\n                units: \"DN\"\n                }],\n                output: {\n                id: \"default\",\n                bands: 1,\n                sampleType: SampleType.FLOAT32\n                }\n            }\n            }\n\n            function evaluatePixel(sample) {\n            let ndvi = (sample.B08 - sample.B04) / (sample.B08 + sample.B04)\n            return [ ndvi ]\n            }"
}'

Please try the request below. Note that requesting data from 2016 to 2023 at once is too much for Processing API. You can either use Asynchronous Processing API or shorten the time range as I did.

curl -X POST https://services.sentinel-hub.com/api/v1/process \
 -H 'Content-Type: application/json' \
 -H 'Authorization: Bearer ' \
 -H 'Accept: application/tar' \
 -d '{
  "input": {
    "bounds": {
      "geometry": {
        "type": "Polygon",
        "coordinates": [
          [
            [
              1579250.82367497,
              6861560.75494123
            ],
            [
              1579262.05009723,
              6861568.0993758
            ],
            [
              1579274.53666044,
              6861572.98902966
            ],
            [
              1579287.75641312,
              6861575.2175475
            ],
            [
              1579301.15146001,
              6861574.6908805
            ],
            [
              1579314.15650793,
              6861571.431256
            ],
            [
              1580614.32240361,
              6861098.63910992
            ],
            [
              1580626.20934827,
              6861092.89222752
            ],
            [
              1580636.69971985,
              6861084.86506323
            ],
            [
              1580645.36441237,
              6861074.88597658
            ],
            [
              1580651.8490035,
              6861063.36316948
            ],
            [
              1580655.88825164,
              6861050.76798707
            ],
            [
              1580657.31694429,
              6861037.61563564
            ],
            [
              1580656.07665425,
              6861024.44410741
            ],
            [
              1580652.2181275,
              6861011.79217384
            ],
            [
              1580213.19772315,
              6859964.91889461
            ],
            [
              1580207.16807032,
              6859953.72991754
            ],
            [
              1580199.09260609,
              6859943.92221921
            ],
            [
              1580189.27663079,
              6859935.86657521
            ],
            [
              1580178.09124157,
              6859929.86752367
            ],
            [
              1580165.95930318,
              6859926.15185373
            ],
            [
              1580153.33946234,
              6859924.86003288
            ],
            [
              1580140.70880969,
              6859926.0408975
            ],
            [
              1580128.5448448,
              6859929.64980675
            ],
            [
              1578507.57893836,
              6860588.16085359
            ],
            [
              1578495.82259782,
              6860594.40233978
            ],
            [
              1578485.57332546,
              6860602.90455025
            ],
            [
              1578477.25717289,
              6860613.31406842
            ],
            [
              1578471.21983892,
              6860625.19819229
            ],
            [
              1578467.71229861,
              6860638.06291925
            ],
            [
              1578466.88036911,
              6860651.37347985
            ],
            [
              1578468.75864619,
              6860664.57656646
            ],
            [
              1578473.26906401,
              6860677.12333377
            ],
            [
              1578480.22413819,
              6860688.49221449
            ],
            [
              1578750.38594929,
              6861043.08417387
            ],
            [
              1578750.45489957,
              6861043.17450606
            ],
            [
              1578969.96138274,
              6861330.22514622
            ],
            [
              1578980.66035828,
              6861341.24507847
            ],
            [
              1579250.82367497,
              6861560.75494123
            ]
          ]
        ]
      },
      "properties": {
        "crs": "http://www.opengis.net/def/crs/EPSG/0/3857"
      }
    },
    "data": [
      {
        "dataFilter": {
          "timeRange": {
            "from": "2023-07-01T00:00:00Z",
            "to": "2023-08-07T23:59:59Z"
          }
        },
        "type": "sentinel-2-l2a"
      }
    ]
  },
  "output": {
    "resx": 10,
    "resy": 10,
    "responses": [
      {
        "identifier": "default",
        "format": {
          "type": "image/tiff"
        }
      },
      {
        "identifier": "userdata",
        "format": {
          "type": "application/json"
        }
      }
    ]
  },
  "evalscript": "//VERSION=3\n// Script to extract a time series of NDVI values using \n// Sentinel 2 Level 2A data and  metadata file.\nfunction setup() {\n    return {\n      input: [{\n        bands: [\"B04\", \"B08\"],\n        units: \"DN\"\n      }],\n      output: {\n        bands: 1,\n        sampleType: SampleType.FLOAT32\n      },\n      mosaicking: Mosaicking.ORBIT\n    }\n    \n  }\n  \n  // The following function is designed to update the number of\n  // output bands without knowing beforehand how many there are\n  function updateOutput(outputs, collection) {\n      Object.values(outputs).forEach((output) => {\n          output.bands = collection.scenes.length;\n      });\n  }\n  // function to generate a json file with a list of the NDVI \n  // dates used in the analysis. \n  function updateOutputMetadata(scenes, inputMetadata, outputMetadata) {\n      var dds = [];\n      for (i=0; i<scenes.length; i++){\n        dds.push(scenes[i].date)\n      }\n      outputMetadata.userData = { \"acquisition_dates\":  JSON.stringify(dds) }\n  }\n  \n  function evaluatePixel(samples) {\n    // Precompute an array to contain NDVI observations\n    var n_observations = samples.length;\n    let ndvi = new Array(n_observations).fill(0);\n    \n    // Fill the array with NDVI values\n    samples.forEach((sample, index) => {\n      ndvi[index] = (sample.B08 - sample.B04) / (sample.B08 + sample.B04) ;\n    });\n                       \n    return ndvi;\n  }"
}'

@chung.horng
i tried the request you sent.please find the results below.unfortunately they are still identical.
please let me know what i have been doing wrong.

first time range

https://ibb.co/8grLgd0

second time range:

https://ibb.co/0JV3Pkm

Hi @sentinelhub19 ,

These are multi-band tiffs. Each band represents the NDVI value of one acquisition, and you can find the timestamp in the userdata.json file.

By default, the image is shown as Multiband color (Figure 1). Please select Singleband gray to explore data from different acquisitions (Figure 2).


Figure 1


Figure 2

@chung.horng thank you

@megha.devaraju @chung.horng hi
i would like to know please,
1.is every band represents specific date of acquisition?
2.in qgis, i can visulaize the tiff in grayscale and there are, for each tiff, 27 canal. how can i see the bands? the reason i am asking is, i request ndvis as time-series for two dates. the first, is from 15-06-2023 and the second is from 15-2-2023, and both till 09-08-2023. i receive identical tiffs each has 27 canal. when compariing, for example, canal 1 in the first tiff to canal 2 in the second tiff, they are different.but when comparaing canal 1 of the first tiff to canal 1 of the second tiff, they are the same!!

i would like to, have something like as posted in this link please refer to section Description of representative images it shows two different ndvi values for 4th and 9th of july. i would like to have something like that please. ans that what i expected to see given the start/from and to dates mentioned above.

kindly please explain why that is happeneing and thanks in advance.

Hi @sentinelhub19 ,

  1. Yes, please look at the userdata.json file which is downloaded together with the tiff. It contains the timestamp for each band of your tiff. The first date in the file represents the timestamp of the first channel of your tiff.

  2. Could you please provide the two requests you made in the curl format as I did in the previous response? I can check the requests for you.

  3. The representative image you mentioned is a manually-produced gif. You need to check the userdata.json to find out the timestamp of each band. The time range From and To defines the time range you are interested in. Then, with the ndvi time series script using ORBIT mosaicking, the API creates a mosaic for each day in the defined time range as described in the doc and put the data into a multi-band tiff. The order of the bands depends on the mosaickingOrder. If this parameter is not specified in the request, the default option is mostRecent and you will get a tiff having data from the most recent date (09-08-2023 in your case) in the first channel and data from the least recent date (15-06-2023 or 15-2-2023 in your case) in the last channel.

I would recommend you going through the following webinar, which should help you understand how Processing API and Evalscript work.

Hi @sentinelhub19,

In addition to @chung.horng’s detailed response, I would like to add that you can split these bands within the .tif file into individual layers using the Split Raster Bands feature of the Semi-automatic classification plugin on QGIS. This in combination with the ordered list of dates within the userdata.json file will tell you which layer belongs to which date of acquisition. This is just a suggestion and there may be multiple ways to achieve it.

@chung.horng @megha.devaraju thank you your assistance.i think it is now clear to me.

@megha.devaraju @chung.horng would you please tell me how can i modify the below posted evalscript so that the mosaicking type is **leastRecent** as mentioned here

eval-script for ndvi as time-series

//VERSION=3
// Script to extract a time series of NDVI values using 
// Sentinel 2 Level 2A data and  metadata file.
function setup() {
    return {
      input: [{
        bands: ["B04", "B08"],
        units: "DN"
      }],
      output: {
        bands: 1,
        sampleType: SampleType.FLOAT32
      },
      mosaicking: Mosaicking.ORBIT
    }
    
  }
  
  // The following function is designed to update the number of
  // output bands without knowing beforehand how many there are
  function updateOutput(outputs, collection) {
      Object.values(outputs).forEach((output) => {
          output.bands = collection.scenes.length;
      });
  }
  // function to generate a json file with a list of the NDVI 
  // dates used in the analysis. 
  function updateOutputMetadata(scenes, inputMetadata, outputMetadata) {
      var dds = [];
      for (i=0; i<scenes.length; i++){
        dds.push(scenes[i].date)
      }
      outputMetadata.userData = { "acquisition_dates":  JSON.stringify(dds) }
  }
  
  function evaluatePixel(samples) {
    // Precompute an array to contain NDVI observations
    var n_observations = samples.length;
    let ndvi = new Array(n_observations).fill(0);
    
    // Fill the array with NDVI values
    samples.forEach((sample, index) => {
      ndvi[index] = (sample.B08 - sample.B04) / (sample.B08 + sample.B04) ;
    });
                       
    return ndvi;
  }

You can do so by including "mosaickingOrder": "leastRecent" in the data part of your request. An example curl request is below.

curl -X POST https://services.sentinel-hub.com/api/v1/process \
 -H 'Content-Type: application/json' \
 -H 'Authorization: Bearer <YOUR_TOKEN_HERE>' \
 -H 'Accept: application/tar' \
 -d '{
  "input": {
    "bounds": {
      "bbox": [
        12.44693,
        41.870072,
        12.541001,
        41.917096
      ]
    },
    "data": [
      {
        "dataFilter": {
          "timeRange": {
            "from": "2023-02-15T00:00:00Z",
            "to": "2023-08-09T23:59:59Z"
          },
          "mosaickingOrder": "leastRecent"
        },
        "type": "sentinel-2-l2a"
      }
    ]
  },
  "output": {
    "width": 779.8034286939699,
    "height": 523.469,
    "responses": [
      {
        "identifier": "default",
        "format": {
          "type": "image/tiff"
        }
      },
      {
        "identifier": "userdata",
        "format": {
          "type": "application/json"
        }
      }
    ]
  },
  "evalscript": "//VERSION=3\n// Script to extract a time series of NDVI values using \n// Sentinel 2 Level 2A data and  metadata file.\nfunction setup() {\n    return {\n      input: [{\n        bands: [\"B04\", \"B08\"],\n        units: \"DN\"\n      }],\n      output: {\n        bands: 1,\n        sampleType: SampleType.FLOAT32\n      },\n      mosaicking: Mosaicking.ORBIT\n    }\n    \n  }\n  \n  // The following function is designed to update the number of\n  // output bands without knowing beforehand how many there are\n  function updateOutput(outputs, collection) {\n      Object.values(outputs).forEach((output) => {\n          output.bands = collection.scenes.length;\n      });\n  }\n  // function to generate a json file with a list of the NDVI \n  // dates used in the analysis. \n  function updateOutputMetadata(scenes, inputMetadata, outputMetadata) {\n      var dds = [];\n      for (i=0; i<scenes.length; i++){\n        dds.push(scenes[i].date)\n      }\n      outputMetadata.userData = { \"acquisition_dates\":  JSON.stringify(dds) }\n  }\n  \n  function evaluatePixel(samples) {\n    // Precompute an array to contain NDVI observations\n    var n_observations = samples.length;\n    let ndvi = new Array(n_observations).fill(0);\n    \n    // Fill the array with NDVI values\n    samples.forEach((sample, index) => {\n      ndvi[index] = (sample.B08 - sample.B04) / (sample.B08 + sample.B04) ;\n    });\n                       \n    return ndvi;\n  }"
}'

You can also set this in the Request Builder by enabling Show Advanced Options under Data Collections as shown at the end of my reply to your question.

Please do go through the very descriptive documentation and API Reference available to make it easy for the users to create their own requests.