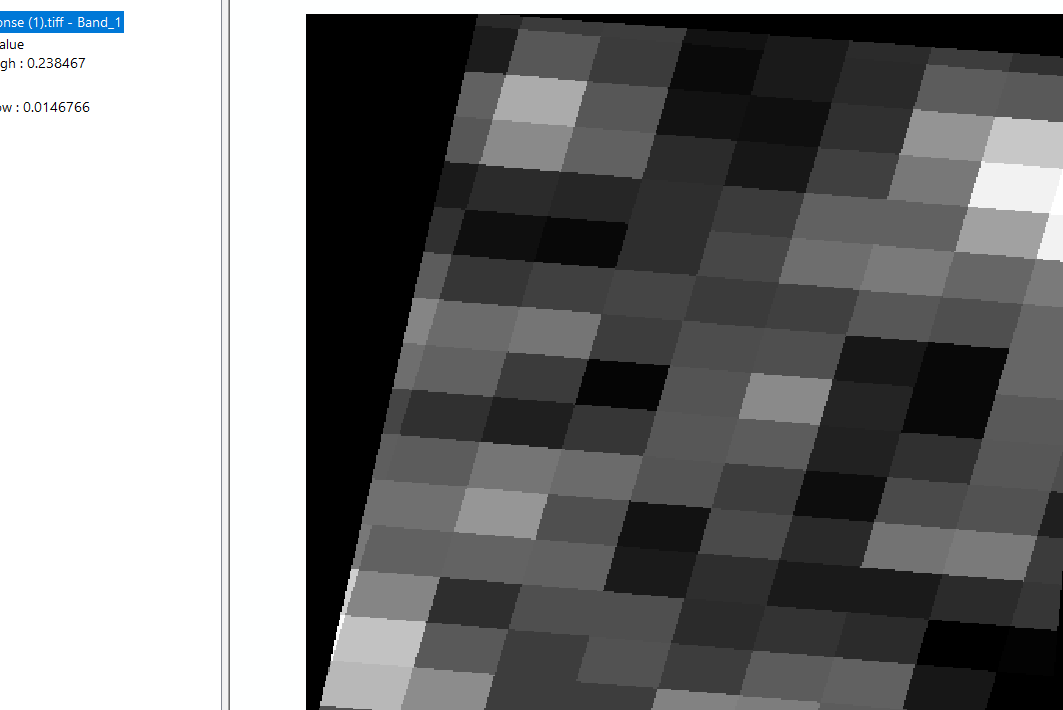
After generating images for SENTINEL1_IW , the images generated has zigzag at the end of each pixel (Edges are not smoothened). Could anyone provide me a solution to the problem . Related image for the current problem is been attached
Thanks in advance
Can you provide an exemplery WCS request (or process API request), so that we can look at the data?
Do mask second half of the instance ID.
request = SentinelHubRequest(
evalscript=evalscript,
data_folder=‘test_folder’,
input_data=[
SentinelHubRequest.input_data(
data_collection=DataCollection.SENTINEL1,
time_interval=time_interval,
#mosaicking_order=‘leastRecent’,
other_args={‘processing’: {‘upsampling’: ‘BICUBIC’, ‘downsampling’:‘BICUBIC’}}
)
],
responses=[
    SentinelHubRequest.output_response('default', MimeType.TIFF)

],
geometry=full_geometry,
config=config,
)
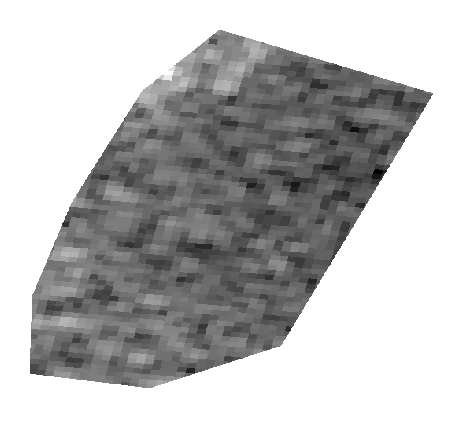
Also i am getting pixels in rectangular shape not in square shape. Can you help me out with this also?
Thanks in advance
Sorry, but these information are not suffciient. I would need an actual WCS request, with (part of) the instance ID, geometry, etc.
Rectangular shape of pixels gives me thinking that you are asking for data in one CRS and then looking it in another.
geometry: {
“type”: “Feature”,
“properties”: {},
“geometry”: {
“type”: “Polygon”,
“coordinates”: [
[
[
13.616695404052733,
55.60378425907516
],
[
13.616652488708496,
55.60237811582409
],
[
13.618841171264648,
55.602111427797
],
[
13.621244430541992,
55.60288724247757
],
[
13.62403392791748,
55.60749332614035
],
[
13.620128631591797,
55.6086568827453
],
[
13.618712425231932,
55.60754180835474
],
[
13.617424964904785,
55.605505503747814
],
[
13.616695404052733,
55.60378425907516
]
]
]
}
}
}
Sorry i did not get this point “you are asking for data in one CRS and then looking it in another.”
from sentinelhub import SHConfig
import os

# In case you put the credentials into the configuration file you can leave this unchanged

CLIENT_ID = 'ccc98716-b027-4e2c-8341-b6261974b0ed'
CLIENT_SECRET = '<SECRET>'
config = SHConfig()

if CLIENT_ID and CLIENT_SECRET:
   config.sh_client_id = CLIENT_ID
   config.sh_client_secret = CLIENT_SECRET

if config.sh_client_id == '' or config.sh_client_secret == '':
   print("Warning! To use Sentinel Hub services, please provide the credentials (client ID and client secret).")


from sentinelhub import MimeType, CRS, BBox, SentinelHubRequest, SentinelHubDownloadClient,DataCollection, bbox_to_dimensions, DownloadRequest,Geometry


inputjson ={
    "data": {

                    "geojson": {
                        "type": "Feature",
                             "properties": {},
                             "geometry": {
                               "type": "Polygon",
                               "coordinates":  [
                    [
                      [
                        13.616695404052733,
                        55.60378425907516
                      ],
                      [
                        13.616652488708496,
                        55.60237811582409
                      ],
                      [
                        13.618841171264648,
                        55.602111427797
                      ],
                      [
                        13.621244430541992,
                        55.60288724247757
                      ],
                      [
                        13.62403392791748,
                        55.60749332614035
                      ],
                      [
                        13.620128631591797,
                        55.6086568827453
                      ],
                      [
                        13.618712425231932,
                        55.60754180835474
                      ],
                      [
                        13.617424964904785,
                        55.605505503747814
                      ],
                      [
                        13.616695404052733,
                        55.60378425907516
                      ]
                    ]
                  ]
                             }
                           }
                    }
}

print (inputjson['data']['attributes'][0]['geojson'])

full_geometry = Geometry(inputjson['data']['attributes'][0]['geojson']['geometry'], crs=CRS.WGS84)


time_interval = '2018-04-20', '2018-08-22'

evalscript="""

function setup() {
  return {
    input: ['VV','VH','dataMask'],output: {bands: 3,sampleType: 'float32',mosaicking: "ORBIT"}
    }
    }
function evaluatePixel(sample) {

    return [sample.VV, sample.VH]
    }


"""


request = SentinelHubRequest(
    evalscript=evalscript,
    data_folder='test_sar_zigzag',
    input_data=[
        SentinelHubRequest.input_data(
            data_collection=DataCollection.SENTINEL1,
            time_interval=time_interval,
            #mosaicking_order='leastRecent',
            other_args={'processing': {'upsampling': 'BICUBIC', 'downsampling':'BICUBIC'}}
        )
    ],
    responses=[

        SentinelHubRequest.output_response('default', MimeType.TIFF)

    ],
    geometry=full_geometry,
    config=config,


)Your request is for data in WGS84 (lat/lon) coordinate system (EPSG:4326). I am guessing that you are then visualising these data in some GIS, which defaults to Popular Web Mercator (EPSG:3857).
Can you upload the output of the service here? The GeoTiff?
response.tiff (326.2 KB)
If I open this in QGIS, in EPSG:4326, I see square pixels and perfectly normal border.
I would therefore say that the output of the script (and Sentinel Hub service) is perfectly fine, the problem lies in the application you are using to analyse these data.


Thanks alot for helping me
For different tiles, the resolution is also changing (for example it is not 10m resolution for all tile id).And also from wgs84, i am not getting a resolution in the meter. How do i change it to meters?. Could you help me out with this
meta data : {‘driver’: ‘GTiff’, ‘dtype’: ‘float32’, ‘nodata’: None, ‘width’: 256, ‘height’: 256, ‘count’: 1, ‘crs’: CRS.from_epsg(4326), ‘transform’: Affine(7.962808012961474e-06, 0.0, -1.8731689453124998,
0.0, -3.691766714664091e-06, 52.28584181468506)}
Affline A and D values are not same (may be because of this we are getting the pixels in rectangular shape). File is been attached
response.tiff (26.1 KB)
Thanks in advance
I am getting strange result from the SAR output. Output 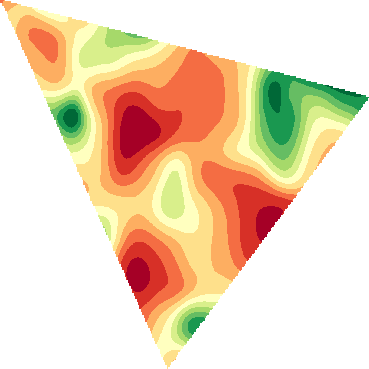 .
.
expected result is something like this 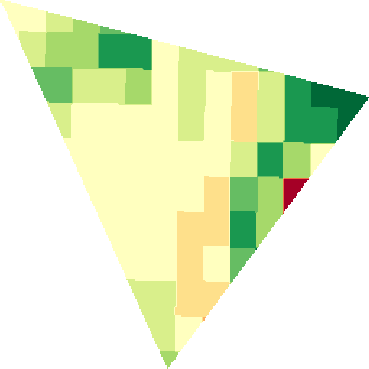
The expected result is in pixel format
Could anyone help me in figuring out the things
Request:
evalscript=“”"
function setup() {
return {
input: [‘VH’,‘VV’],output: {bands: 2,sampleType: ‘float32’,mosaicking: “SIMPLE”}
}
}
function evaluatePixel(sample) {
var VVdB = toDb(sample.VV)
var VHdB = toDb(sample.VH)
return [VVdB,VHdB]
}
// definition of “toDb” function
function toDb(linear) {
var log = 10 * Math.log(linear) / Math.LN10 // VV and VH linear to decibels
//var val = Math.max(Math.min(log, 10), -50) // all values to interval from -30 to 5 dB
//var norm = (val+30)/35 // Normalization: (val-min)/(max-min) max=5, min=-30
return log
}
Thanks in advance
Hello,
Are you using the same request body as you were in your previous post, or are you using a different method to access the data? If it is different, could you post the details of your request for us to reproduce your result please?
The reason I’m asking is that with your evalscript and your previous AOI, I get this image:
Maxim
This is the latest request we used, now we could resolve the issue we faced
request = SentinelHubRequest(
evalscript=evalscript,
data_folder=‘test_sar_test’,
input_data=[
SentinelHubRequest.input_data(
data_collection=DataCollection.SENTINEL1_IW,
time_interval=time_interval,
              mosaicking_order='leastRecent',
              #other_args={'processing': {'upsampling': 'BICUBIC', 'downsampling':'BICUBIC'}}
          )
      ],
      responses=[

          SentinelHubRequest.output_response('default', MimeType.TIFF)

      ],
      geometry=full_geometry,
      config=config,


)Hello one more question, How to do we get UTM zone for each image obtained for the region. Also, we are getting the data in degree. How do we get it in meters?
Thanks in advance
Hi,
Glad you solved your other problem.
For the UTM zones, you can either determine them manually: a KML grid of the zones is useful, such as the one here. Otherwise, you could look into a Python package to fetch the UTM zone of your AOI (a quick search brought this one up, but there are surely more).
You are getting data in degrees because you are querying them in WGS84. An easy way of getting your data in meters is to use a projection that has meters as units (UTM for example). You can convert your input AOI coordinates from degrees to meters using a geospatial Python library, then specify the request in UTM coordinates you are interested in. Therefore, in your call
full_geometry = Geometry(<inputjson_coordinates_in_UTM>, crs=CRS.<the_UTM_ZONE>)
with:
- <inputjson_coordinates_in_UTM>: your input json in UTM coordinates
- <the_UTM_ZONE> being the identifier of your UTM zone. For example Zone 58 North:
CRS.UTM_58N
Thank you so much for your help
A post was split to a new topic: Speckle filtering